Forge SPAC Presentation Deck
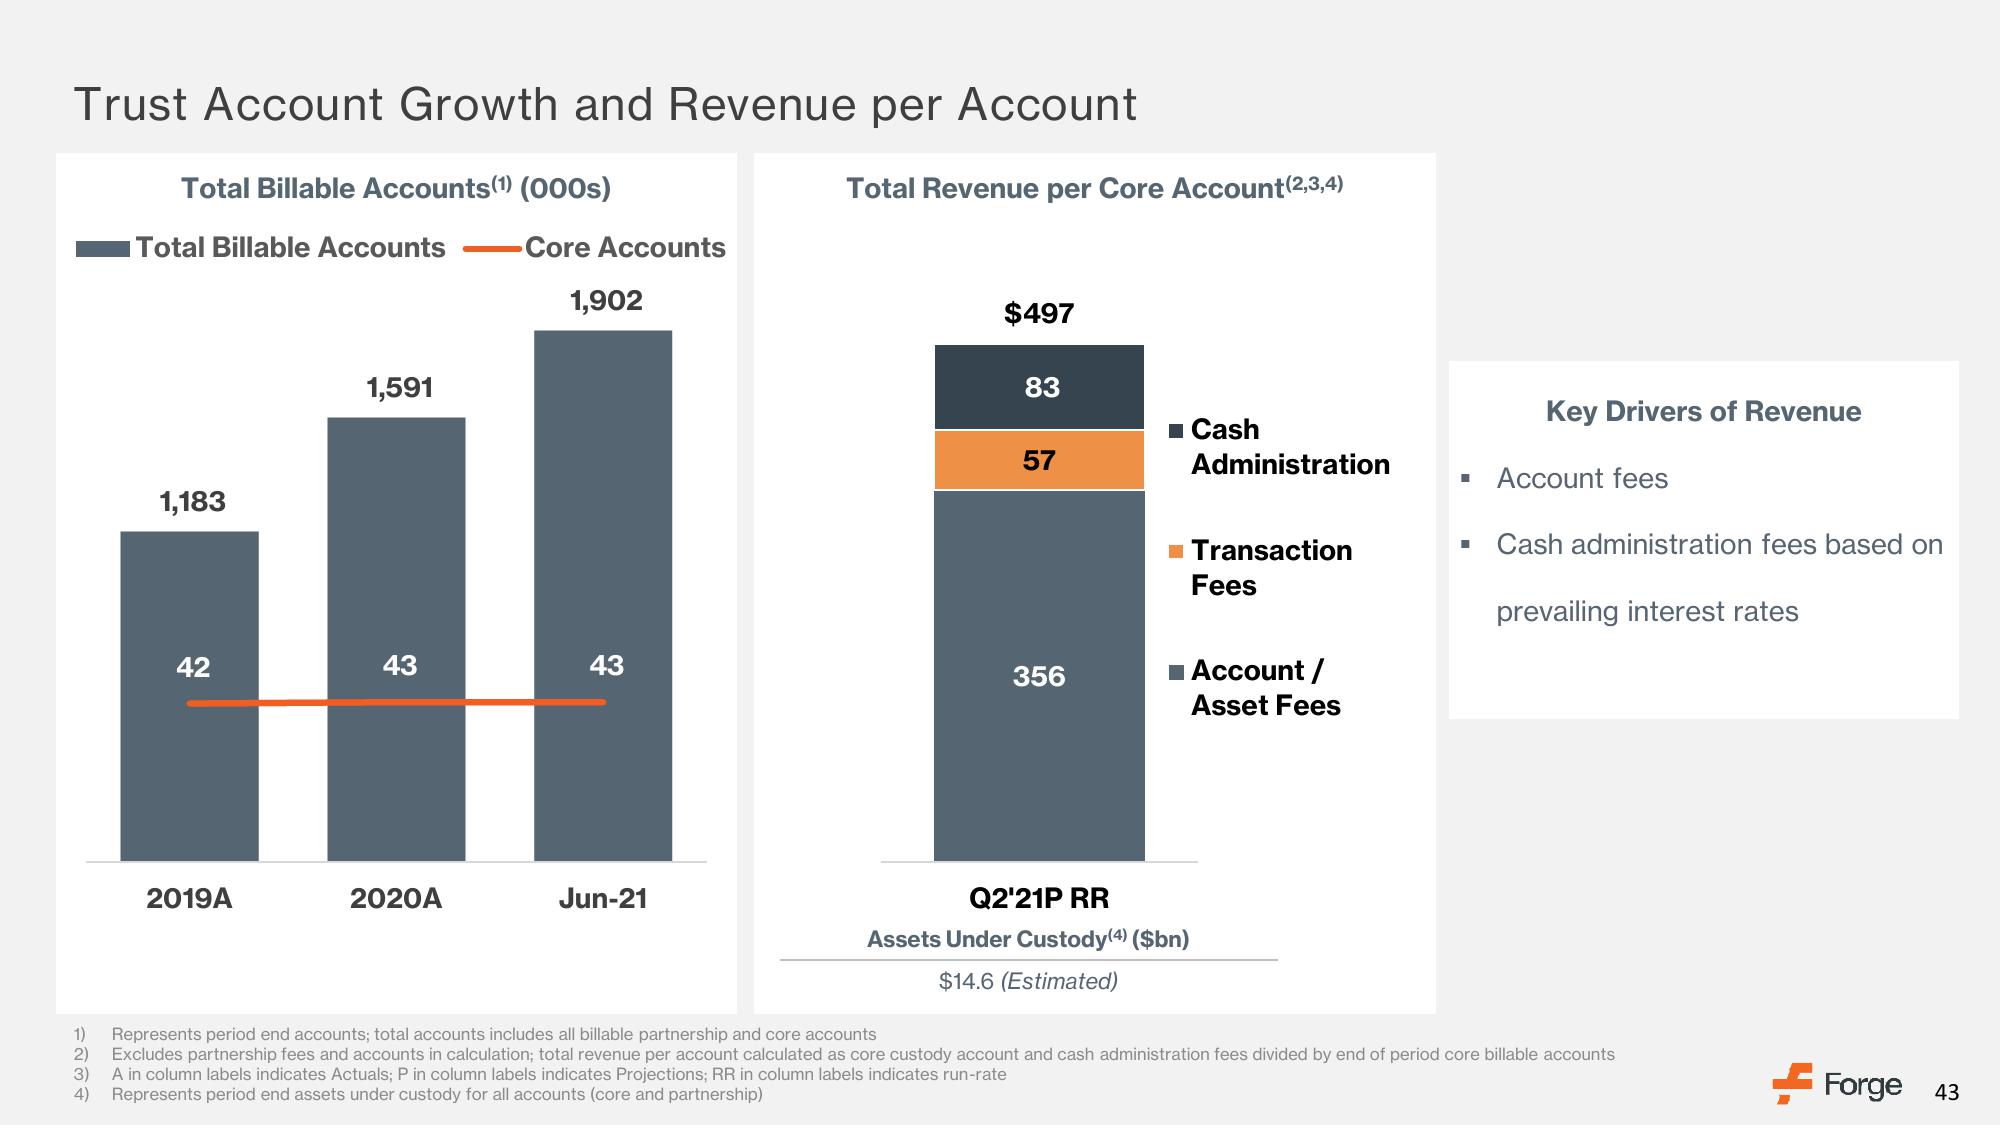
Trust Account Growth and Revenue per Account
Total Billable Accounts(1) (000s)
Total Billable Accounts
1,183
42
2019A
1,591
43
2020A
Core Accounts
1,902
43
Jun-21
Total Revenue per Core Account (2,3,4)
$497
83
57
356
■Cash
Administration
Q2'21P RR
Assets Under Custody(4) ($bn)
$14.6 (Estimated)
Transaction
Fees
■Account/
Asset Fees
■
■
Key Drivers of Revenue
Account fees
Cash administration fees based on
prevailing interest rates
1)
Represents period end accounts; total accounts includes all billable partnership and core accounts
2) Excludes partnership fees and accounts in calculation; total revenue per account calculated as core custody account and cash administration fees divided by end of period core billable accounts
3)
A in column labels indicates Actuals; P in column labels indicates Projections; RR in column labels indicates run-rate
4) Represents period end assets under custody for all accounts (core and partnership)
Forge 43View entire presentation