FIGS Results Presentation Deck
Non-GAAP Financial Measures and Key Operating Metrics (cont.)
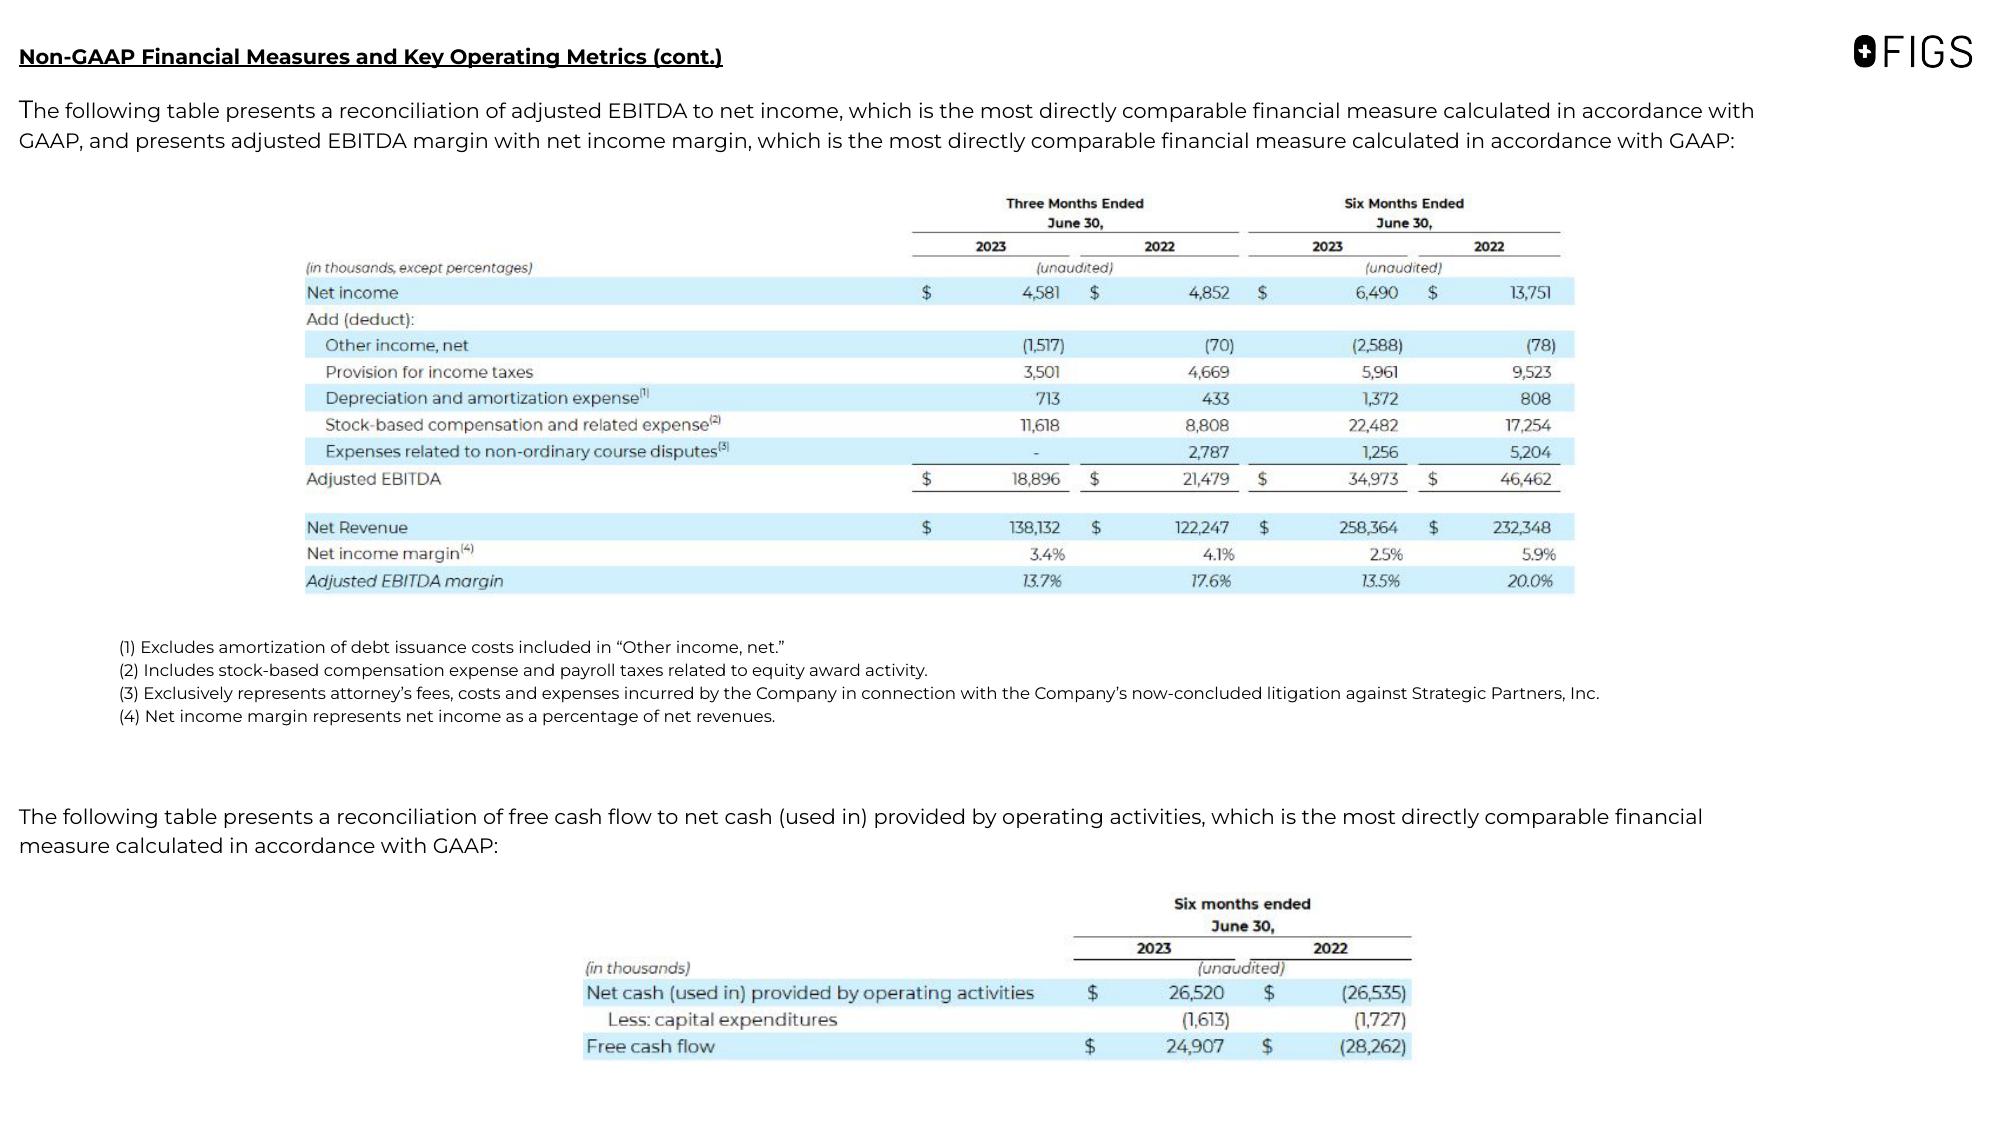
The following table presents a reconciliation of adjusted EBITDA to net income, which is the most directly comparable financial measure calculated in accordance with
GAAP, and presents adjusted EBITDA margin with net income margin, which is the most directly comparable financial measure calculated in accordance with GAAP:
(in thousands, except percentages)
Net income
Add (deduct):
Other income, net
Provision for income taxes
Depreciation and amortization expense
Stock-based compensation and related expense(2)
Expenses related to non-ordinary course disputes (3)
Adjusted EBITDA
Net Revenue
Net income margin()
Adjusted EBITDA margin
$
$
$
2023
Three Months Ended
June 30,
(unaudited)
4,581 $
(1,517)
3,501
713
11,618
18,896
138,132
3.4%
13.7%
$
$
(in thousands)
Net cash (used in) provided by operating activities
Less: capital expenditures
Free cash flow
2022
$
$
4,852
(70)
4,669
433
8,808
2,787
21,479
2023
122,247
4.1%
17.6%
$
$
$
Six months ended
June 30,
2023
(unaudited)
26,520 $
(1,613)
24,907
Six Months Ended
June 30,
$
(unaudited)
6,490 $
(2,588)
5,961
1,372
22,482
1,256
34,973
258,364
2.5%
13.5%
(1) Excludes amortization of debt issuance costs included in "Other income, net."
(2) Includes stock-based compensation expense and payroll taxes related to equity award activity.
(3) Exclusively represents attorney's fees, costs and expenses incurred by the Company in connection with the Company's now-concluded litigation against Strategic Partners, Inc.
(4) Net income margin represents net income as a percentage of net revenues.
The following table presents a reconciliation of free cash flow to net cash (used in) provided by operating activities, which is the most directly comparable financial
measure calculated in accordance with GAAP:
2022
$
$
(26,535)
(1,727)
(28,262)
2022
13,751
(78)
9,523
808
17,254
5,204
46,462
232,348
5.9%
20.0%
OFIGSView entire presentation