Kore Results Presentation Deck
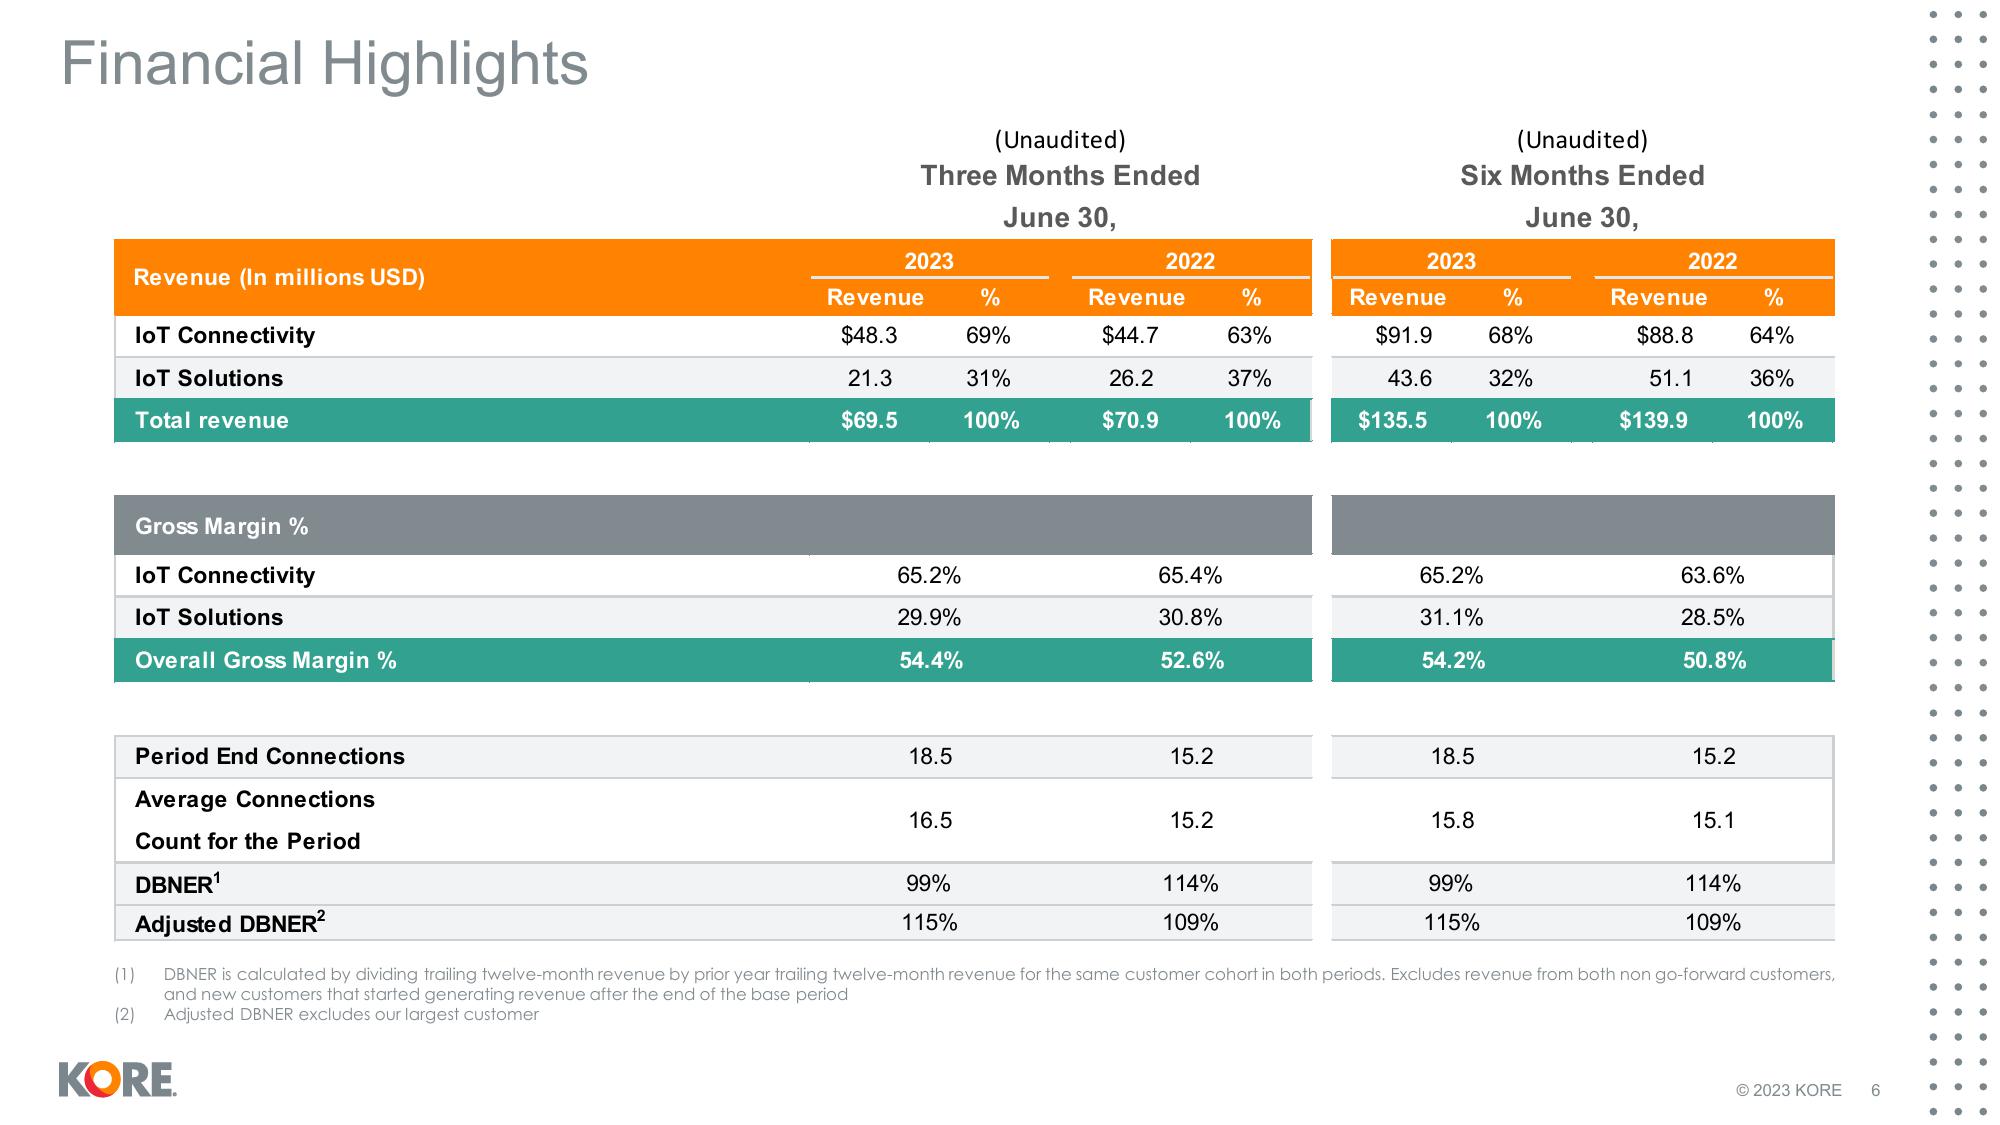
Financial Highlights
Revenue (In millions USD)
IoT Connectivity
IoT Solutions
Total revenue
Gross Margin %
loT Connectivity
loT Solutions
Overall Gross Margin %
Period End Connections
Average Connections
Count for the Period
DBNER¹
Adjusted DBNER²
(1)
(2)
(Unaudited)
Three Months Ended
June 30,
KORE
2023
Revenue
$48.3
21.3
$69.5
65.2%
29.9%
54.4%
18.5
16.5
99%
115%
%
69%
31%
100%
2022
Revenue
$44.7
26.2
$70.9
65.4%
30.8%
52.6%
15.2
15.2
114%
109%
%
63%
37%
100%
(Unaudited)
Six Months Ended
June 30,
2023
Revenue
$91.9
43.6
$135.5
65.2%
31.1%
54.2%
18.5
15.8
99%
115%
%
68%
32%
100%
2022
Revenue
$88.8
51.1
$139.9
63.6%
28.5%
50.8%
15.2
15.1
114%
109%
%
64%
36%
100%
DBNER is calculated by dividing trailing twelve-month revenue by prior year trailing twelve-month revenue for the same customer cohort in both periods. Excludes revenue from both non go-forward customers,
and new customers that started generating revenue after the end of the base period
Adjusted DBNER excludes our largest customer
© 2023 KORE
6
●
●
●
●
•
●
●
●
●
●
●
●
●
●
e
●
.
●
●
● ●
●
●
●
•
●
0
●View entire presentation