Paysafe Results Presentation Deck
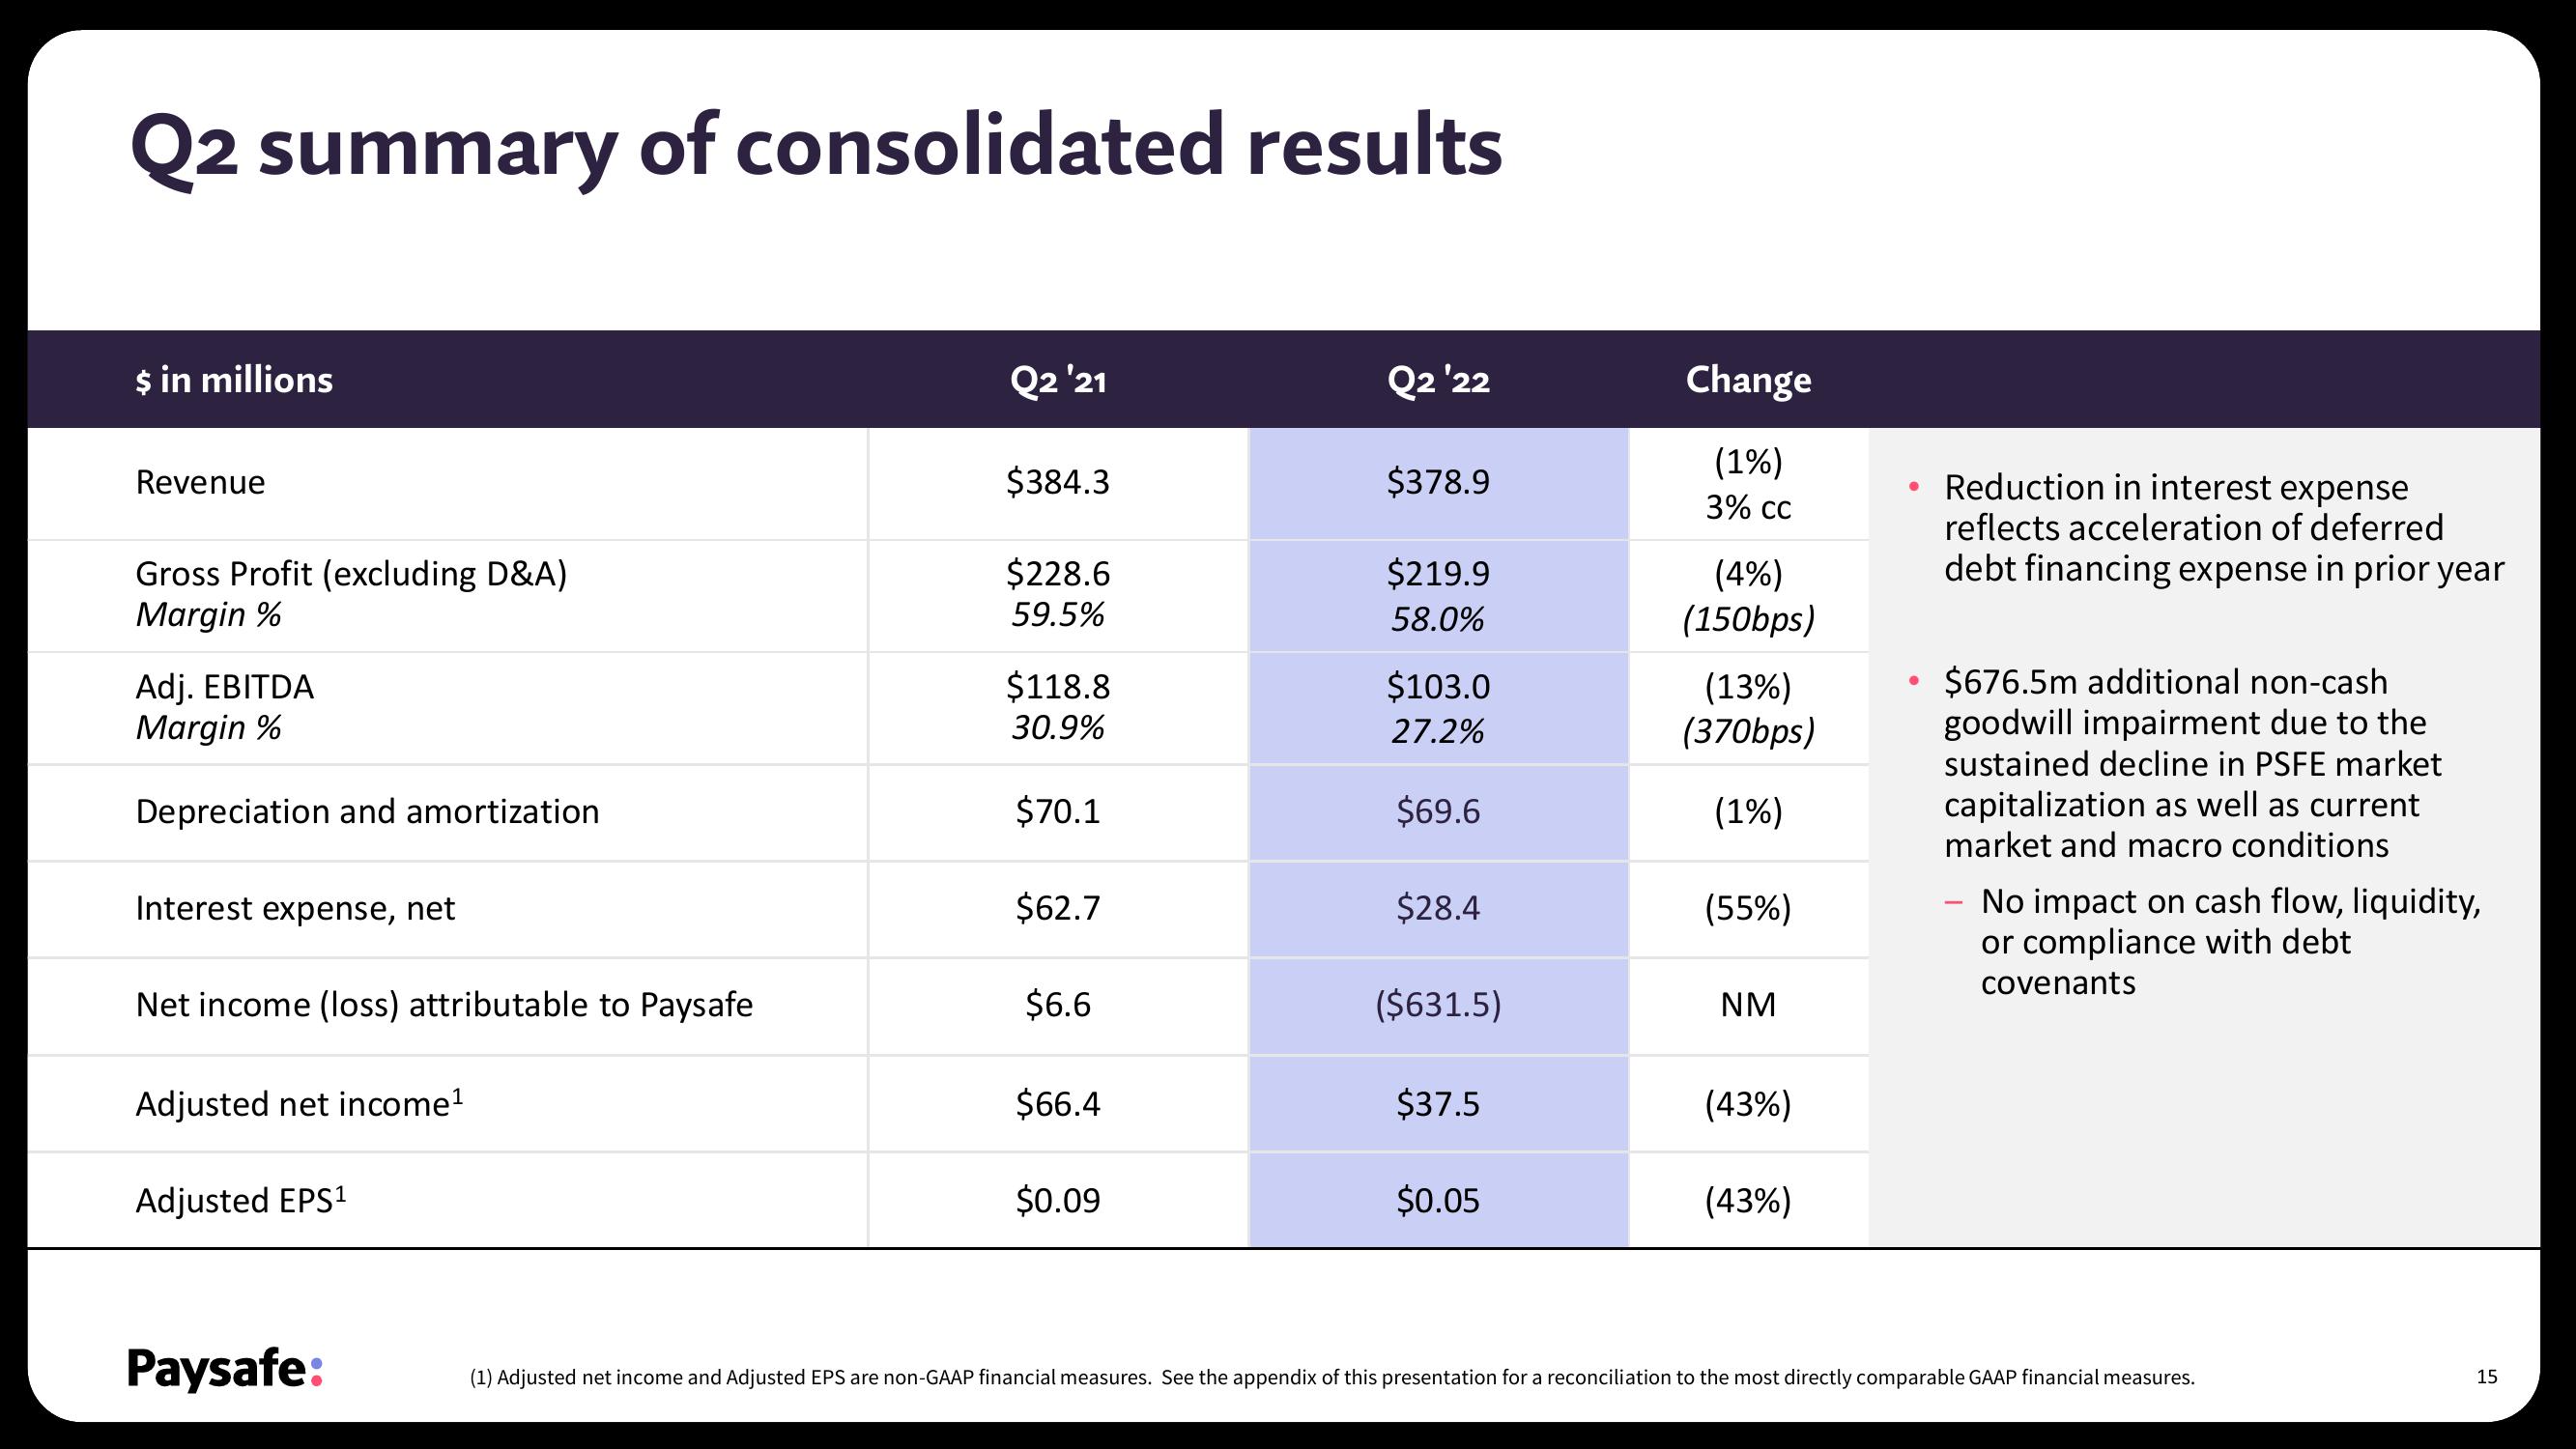
Q2 summary of consolidated results
$ in millions
Revenue
Gross Profit (excluding D&A)
Margin %
Adj. EBITDA
Margin %
Depreciation and amortization
Interest expense, net
Net income (loss) attributable to Paysafe
Adjusted net income¹
Adjusted EPS¹
Paysafe:
Q2 '21
$384.3
$228.6
59.5%
$118.8
30.9%
$70.1
$62.7
$6.6
$66.4
$0.09
Q2 '22
$378.9
$219.9
58.0%
$103.0
27.2%
$69.6
$28.4
($631.5)
$37.5
$0.05
Change
(1%)
3% CC
(4%)
(150bps)
(13%)
(370bps)
(1%)
(55%)
NM
(43%)
(43%)
●
●
Reduction in interest expense
reflects acceleration of deferred
debt financing expense in prior year
$676.5m additional non-cash
goodwill impairment due to the
sustained decline in PSFE market
capitalization as well as current
market and macro conditions
No impact on cash flow, liquidity,
or compliance with debt
covenants
(1) Adjusted net income and Adjusted EPS are non-GAAP financial measures. See the appendix of this presentation for a reconciliation to the most directly comparable GAAP financial measures.
15View entire presentation