jetBlue Results Presentation Deck
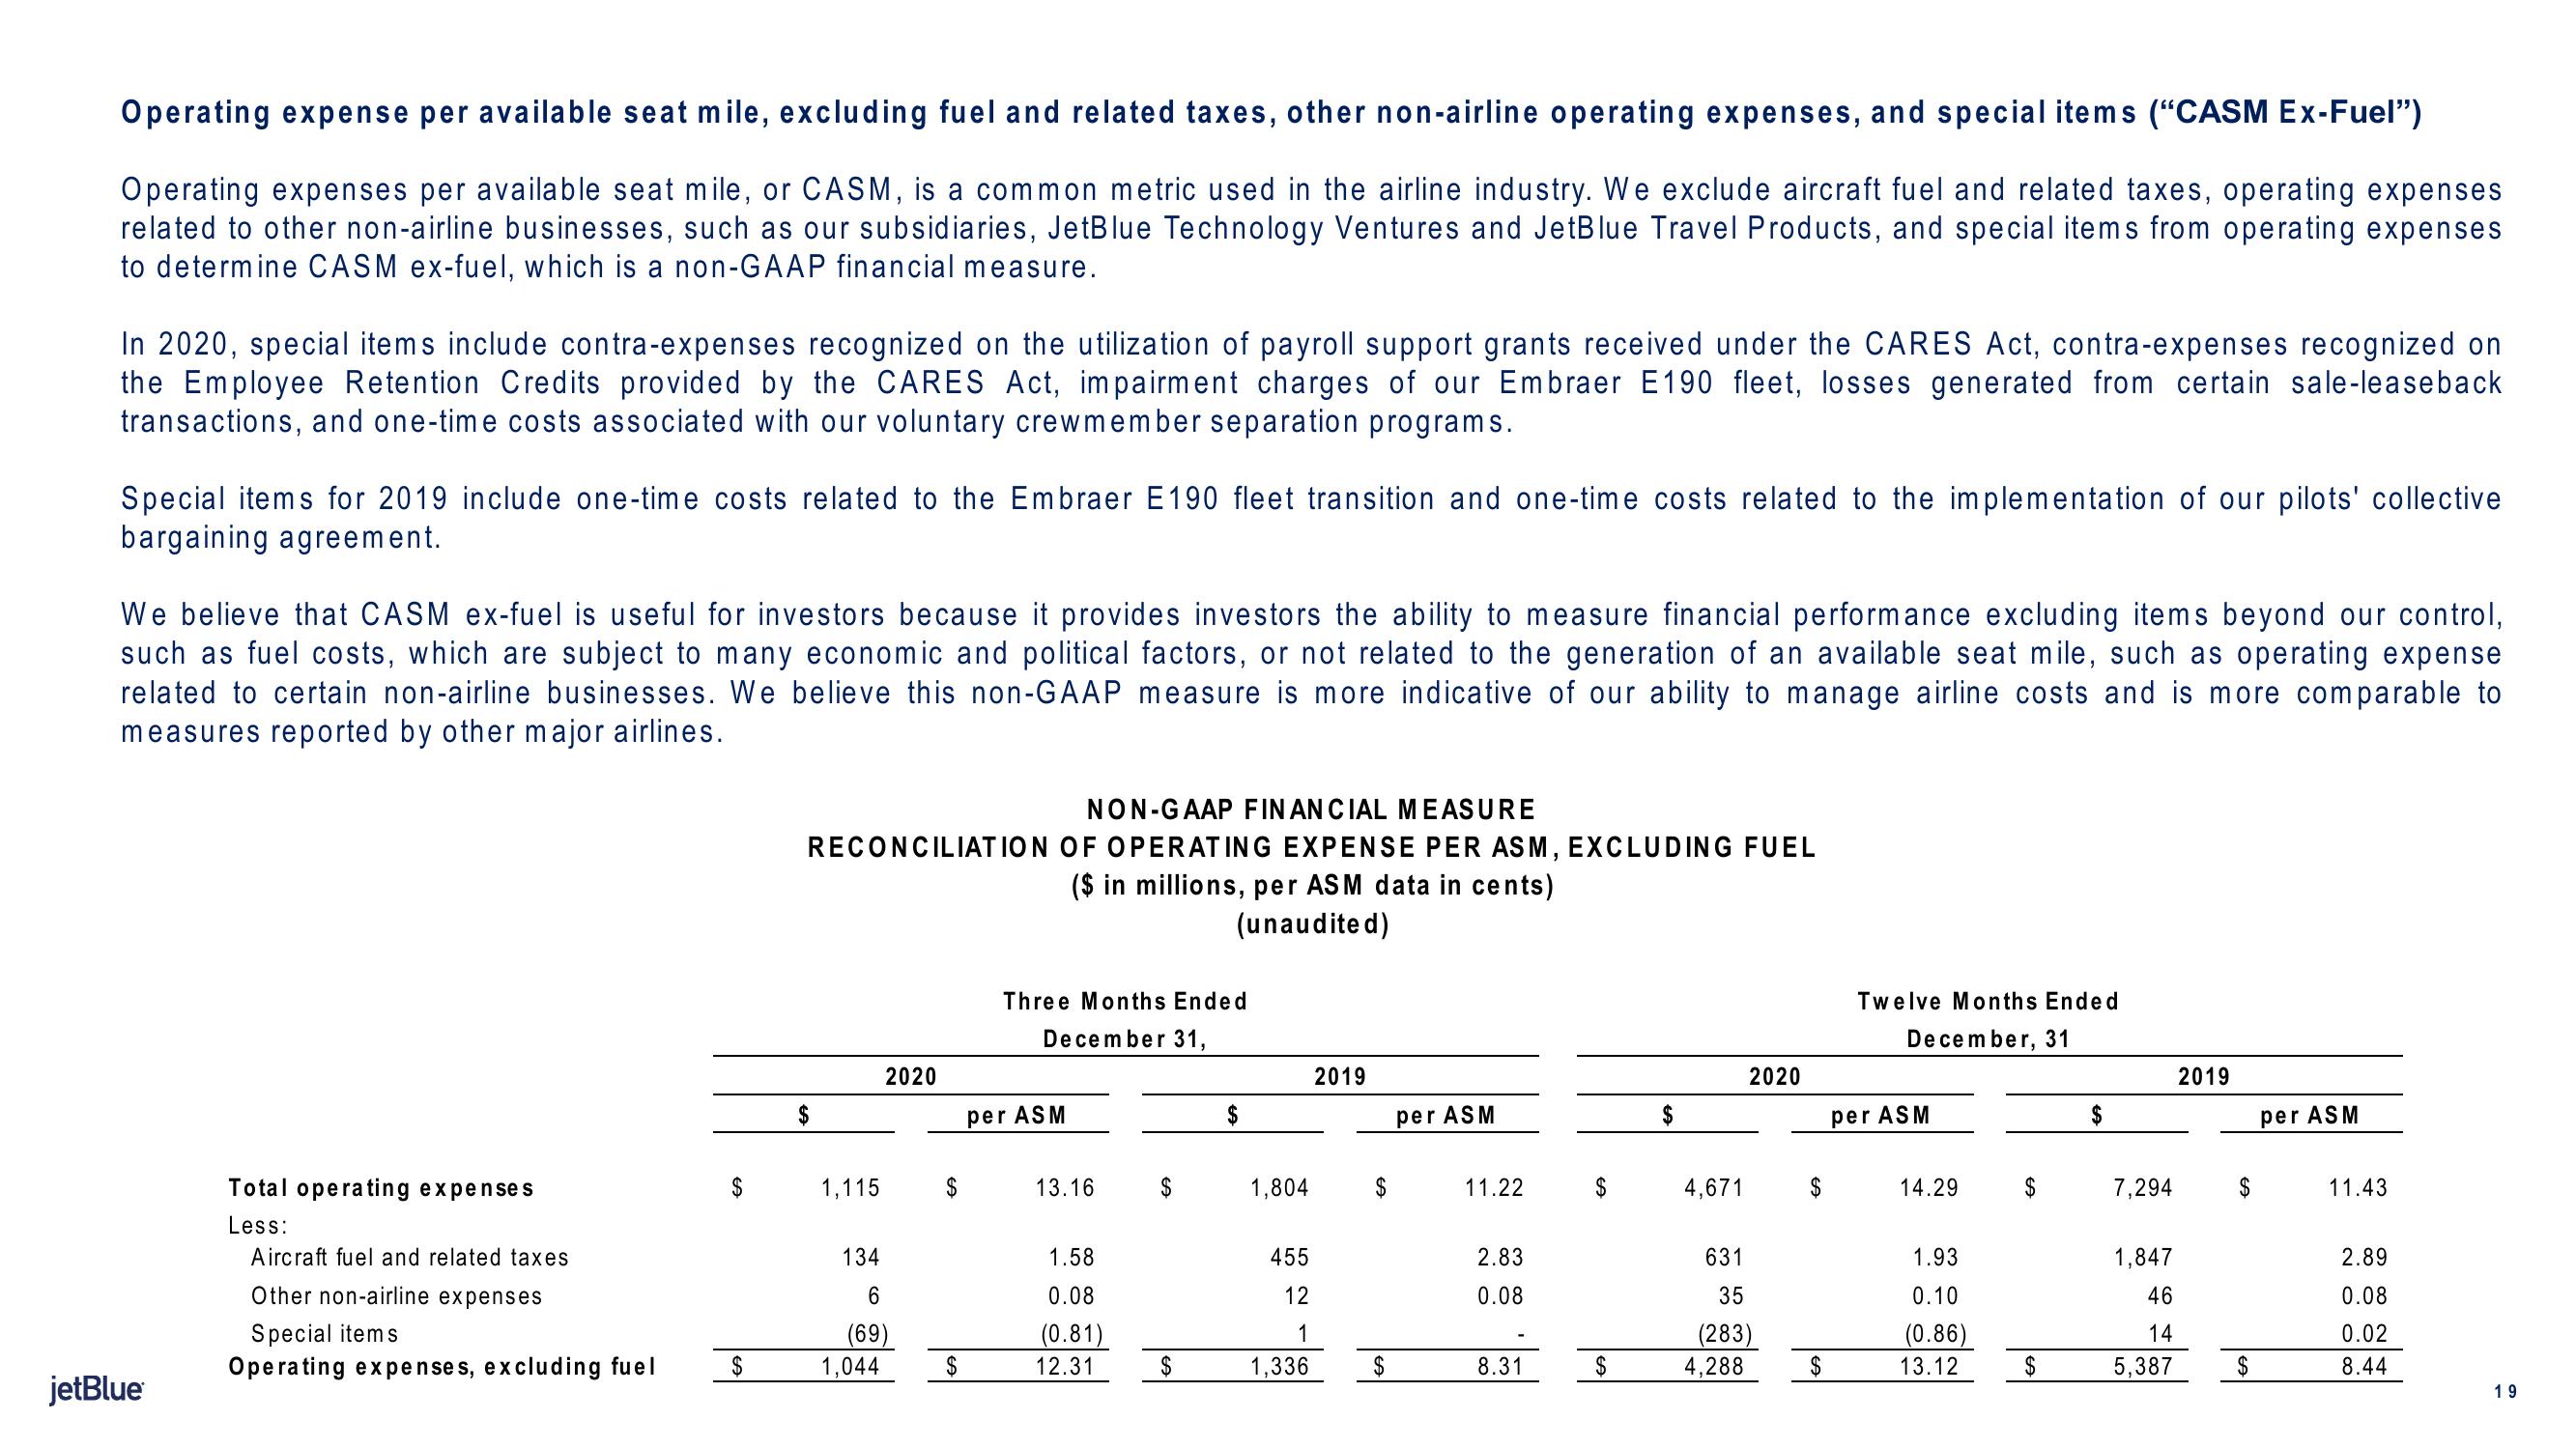
Operating expense per available seat mile, excluding fuel and related taxes, other non-airline operating expenses, and special items ("CASM Ex-Fuel")
Operating expenses per available seat mile, or CASM, is a common metric used in the airline industry. We exclude aircraft fuel and related taxes, operating expenses
related to other non-airline businesses, such as our subsidiaries, JetBlue Technology Ventures and JetBlue Travel Products, and special items from operating expenses
to determine CASM ex-fuel, which is a non-GAAP financial measure.
In 2020, special items include contra-expenses recognized on the utilization of payroll support grants received under the CARES Act, contra-expenses recognized on
the Employee Retention Credits provided by the CARES Act, impairment charges of our Embraer E190 fleet, losses generated from certain sale-leaseback
transactions, and one-time costs associated with our voluntary crew member separation programs.
Special items for 2019 include one-time costs related to the Embraer E190 fleet transition and one-time costs related to the implementation of our pilots' collective
bargaining agreement.
We believe that CASM ex-fuel is useful for investors because it provides investors the ability to measure financial performance excluding items beyond our control,
such as fuel costs, which are subject to many economic and political factors, or not related to the generation of an available seat mile, such as operating expense
related to certain non-airline businesses. We believe this non-GAAP measure is more indicative of our ability to manage airline costs and is more comparable to
measures reported by other major airlines.
jetBlue
Total operating expenses
Less:
Aircraft fuel and related taxes.
Other non-airline expenses
Special items
Operating expenses, excluding fuel
$
$
NON-GAAP FINANCIAL MEASURE
RECONCILIATION OF OPERATING EXPENSE PER ASM, EXCLUDING FUEL
($ in millions, per ASM data in cents)
(unaudited)
$
1,115
2020
134
6
(69)
1,044
$
$
Three Months Ended
December 31,
per ASM
13.16
1.58
0.08
(0.81)
12.31
$
$
$
1,804
455
12
1
1,336
2019
$
$
per ASM
11.22
2.83
0.08
8.31
$
$
$
4,671
2020
631
35
(283)
4,288
$
$
Twelve Months Ended
December, 31
per ASM
14.29
1.93
0.10
(0.86)
13.12
$
$
$
7,294
1,847
46
14
5,387
2019
$
$
per ASM
11.43
2.89
0.08
0.02
8.44
19View entire presentation