AstraZeneca Results Presentation Deck
Oncology
Total Revenue ($m)
1,600
1,400
1,200
1,000
800
600
400
200
☐EM
0
EROW
■ Europe
■US
Q3.
315
232
259
441
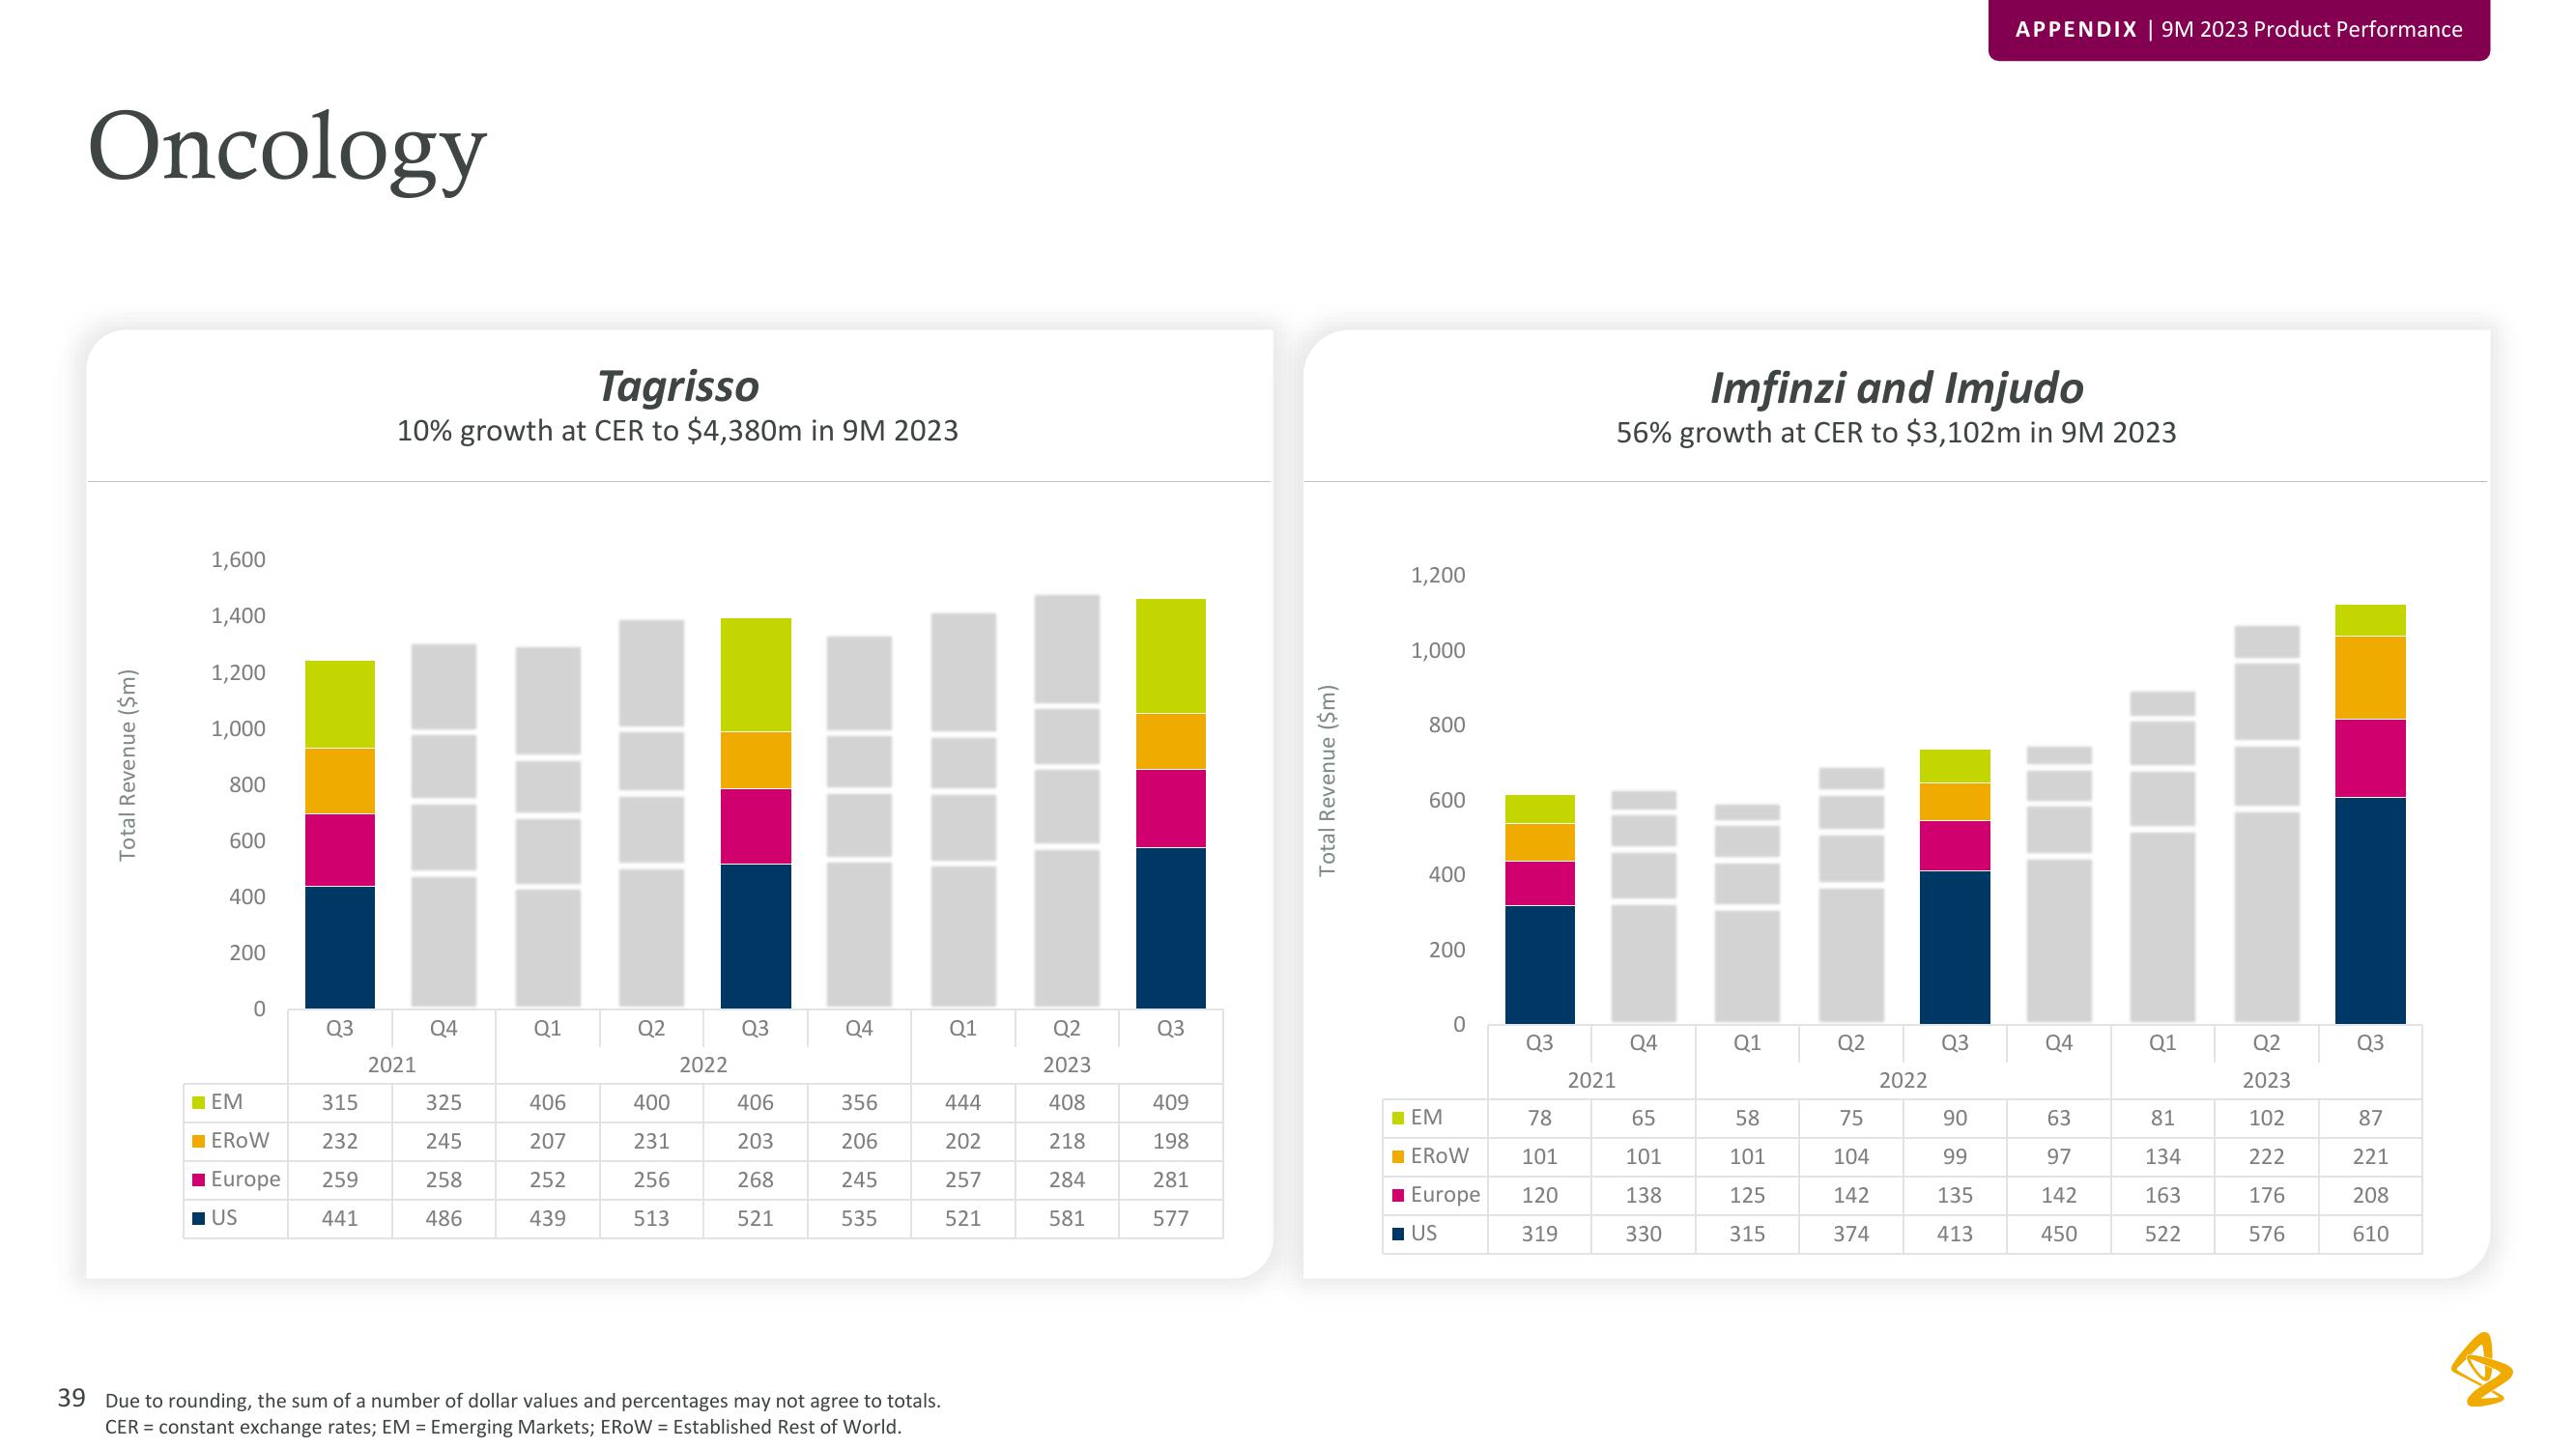
Tagrisso
10% growth at CER to $4,380m in 9M 2023
2021
Q4
325
245
258
486
Q1
406
207
252
439
Q2
400
231
256
513
2022
Q3
406
203
268
521
Q4
356
206
245
535
39 Due to rounding, the sum of a number of dollar values and percentages may not agree to totals.
CER = constant exchange rates; EM = Emerging Markets; EROW = Established Rest of World.
Q1
444
202
257
521
Q2
2023
408
218
284
581
Q3
409
198
281
577
Total Revenue ($m)
1,200
1,000
800
600
400
200
0
☐EM
☐EROW
Europe
■US
Q3
78
101
120
319
Imfinzi and Imjudo
56% growth at CER to $3,102m in 9M 2023
2021
Q4
65
101
138
330
Q1
58
101
125
315
Q2
75
104
142
374
2022
Q3
APPENDIX | 9M 2023 Product Performance
90
99
135
413
Q4
63
97
142
450
01
81
134
163
522
Q2
2023
102
222
176
576
Q3
87
221
208
610View entire presentation