HSBC Investor Day Presentation Deck
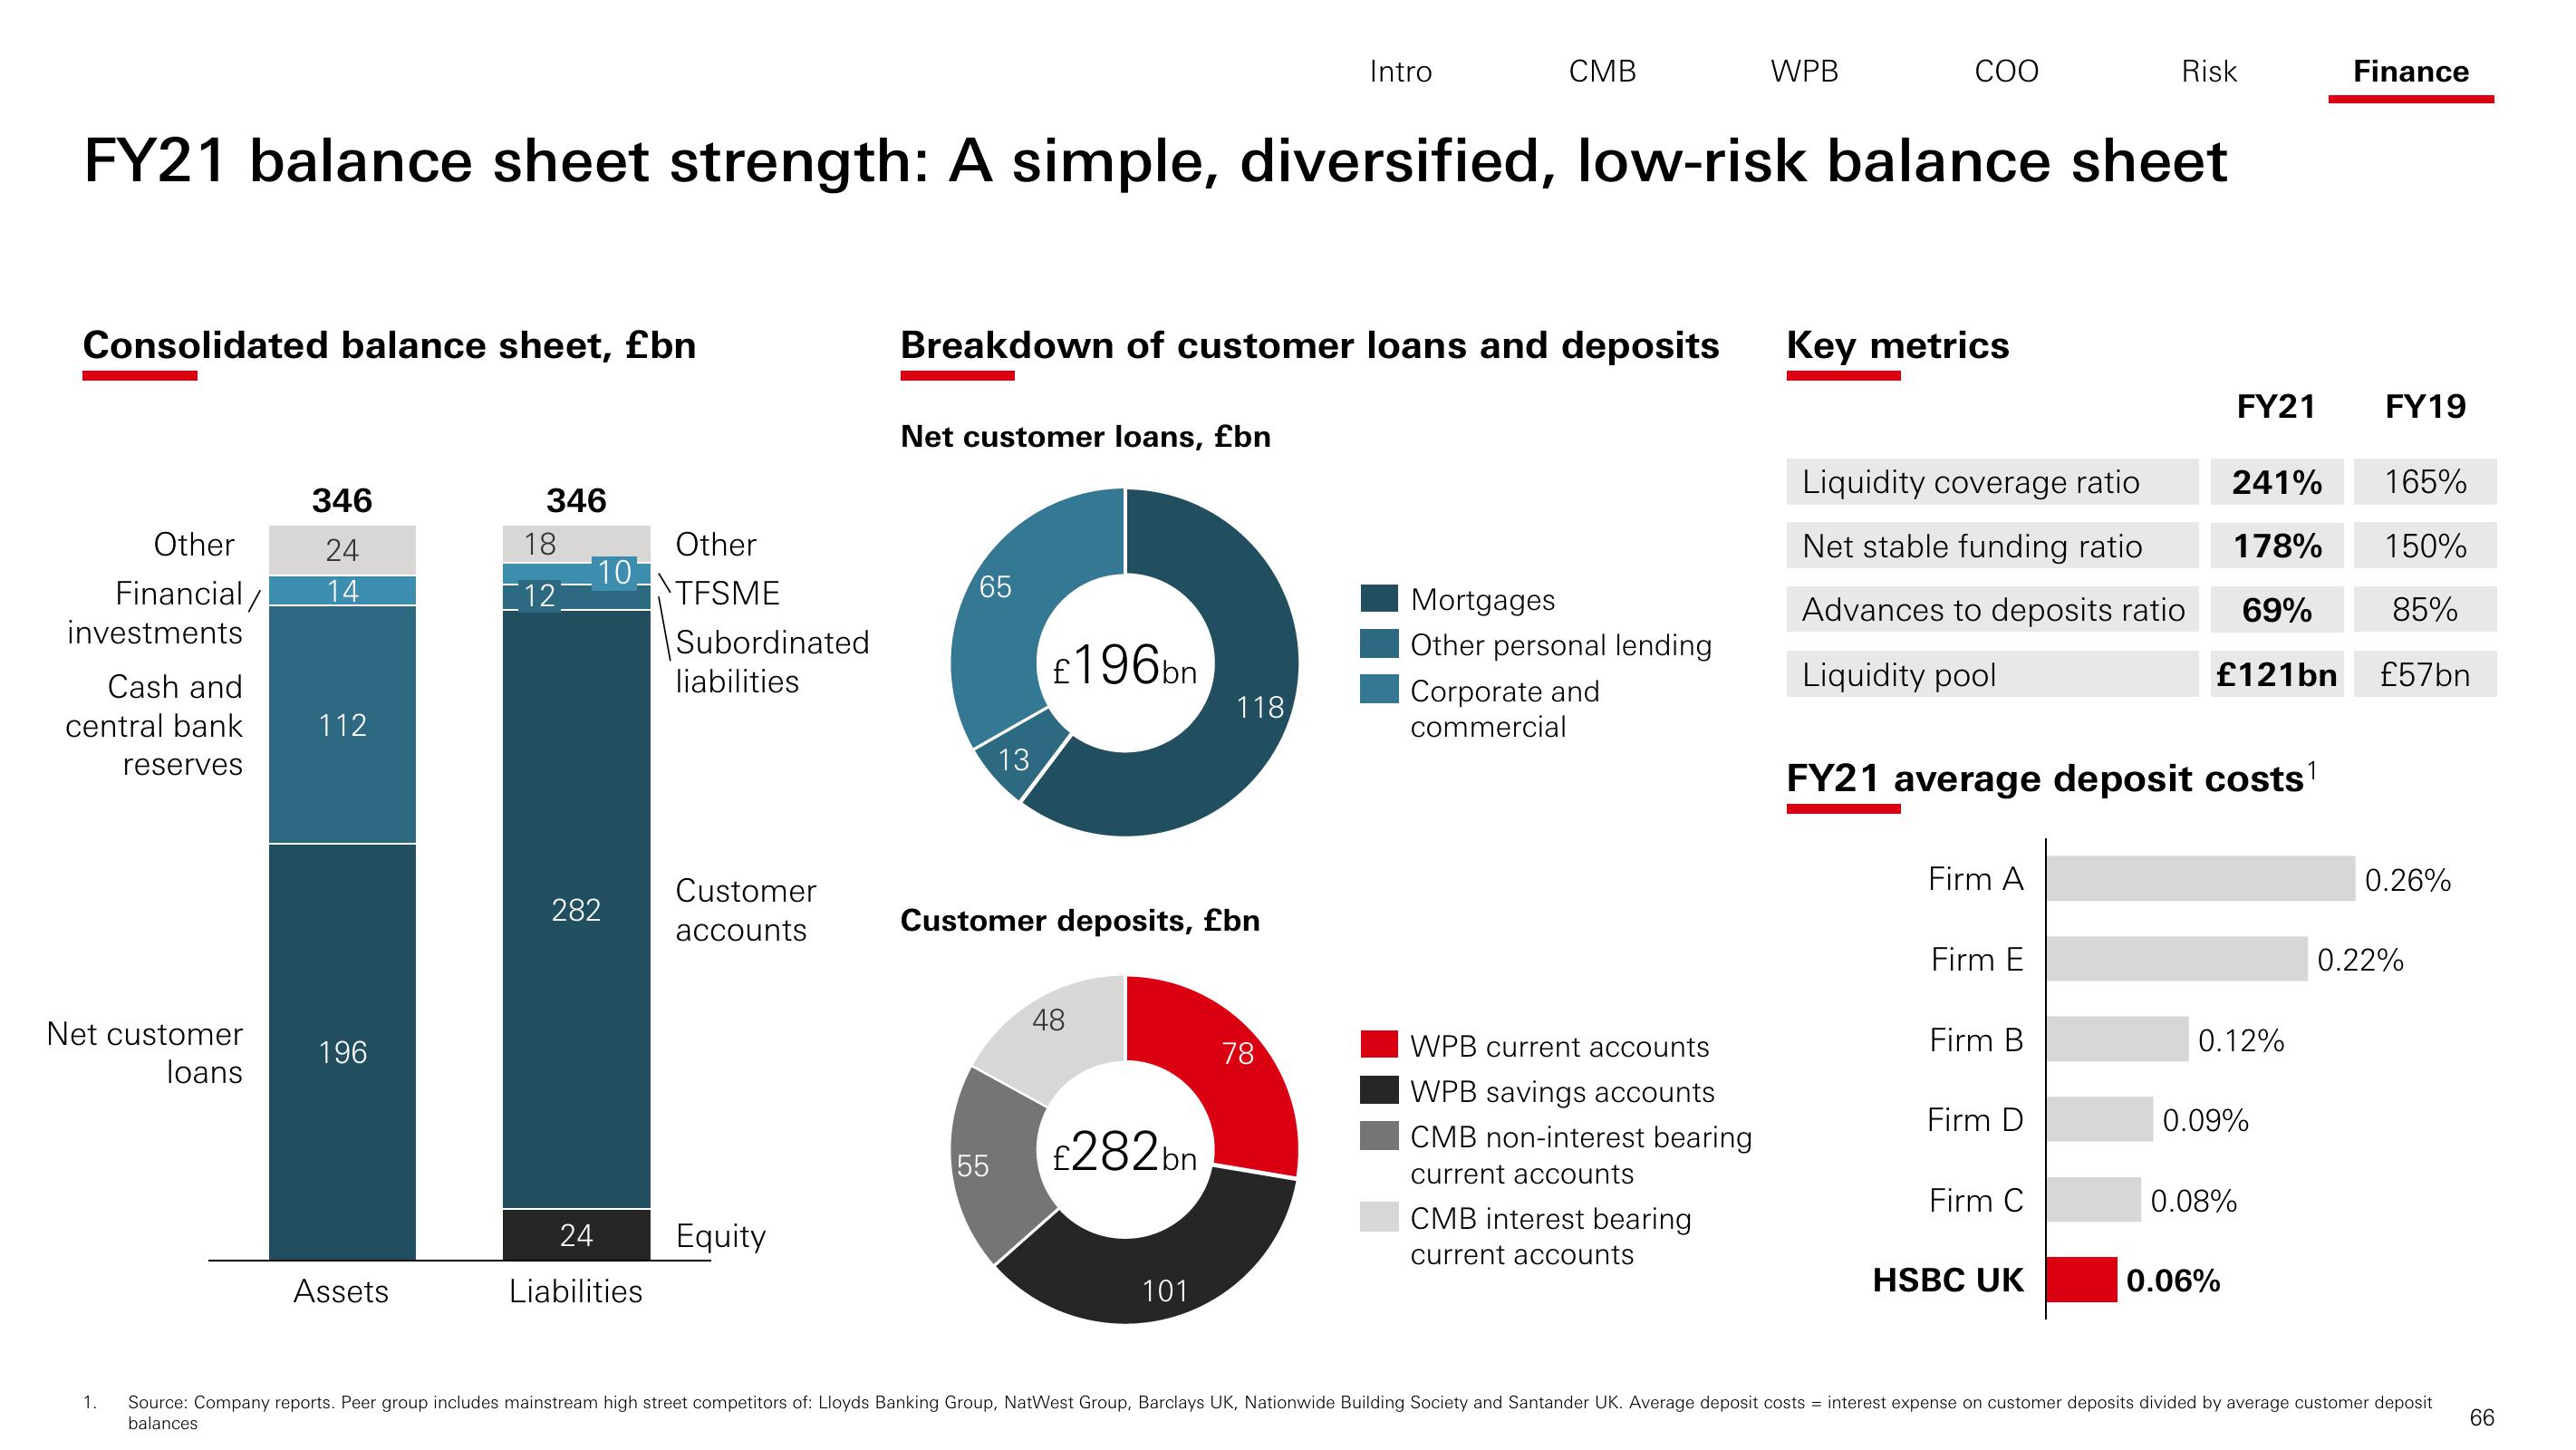
Consolidated balance sheet, £bn
Other
Financial /
investments
Cash and
central bank
reserves
Net customer
loans
FY21 balance sheet strength: A simple, diversified, low-risk balance sheet
1.
346
24
14
112
196
Assets
346
18
12
10]
282
24
Liabilities
Other
TFSME
Subordinated
liabilities
Customer
accounts
Equity
Net customer loans, £bn
Breakdown of customer loans and deposits
65
13
55
£196bn
Customer deposits, £bn
48
£282bn
118
101
Intro
CMB
78
Mortgages
Other personal lending
Corporate and
commercial
WPB current accounts
WPB savings accounts
CMB non-interest bearing
current accounts
WPB
CMB interest bearing
current accounts
COO
Key metrics
Firm A
Firm E
Liquidity coverage ratio
Net stable funding ratio
Advances to deposits ratio
Liquidity pool
FY21 average deposit costs ¹
Firm B
Firm D
Risk
Firm C
HSBC UK
FY21
0.12%
241% 165%
178% 150%
69% 85%
£121bn £57bn
0.09%
0.08%
0.06%
Finance
FY19
0.26%
0.22%
Source: Company reports. Peer group includes mainstream high street competitors of: Lloyds Banking Group, NatWest Group, Barclays UK, Nationwide Building Society and Santander UK. Average deposit costs = interest expense on customer deposits divided by average customer deposit
balances
66View entire presentation