Sonder Investor Presentation Deck
Financial Overview
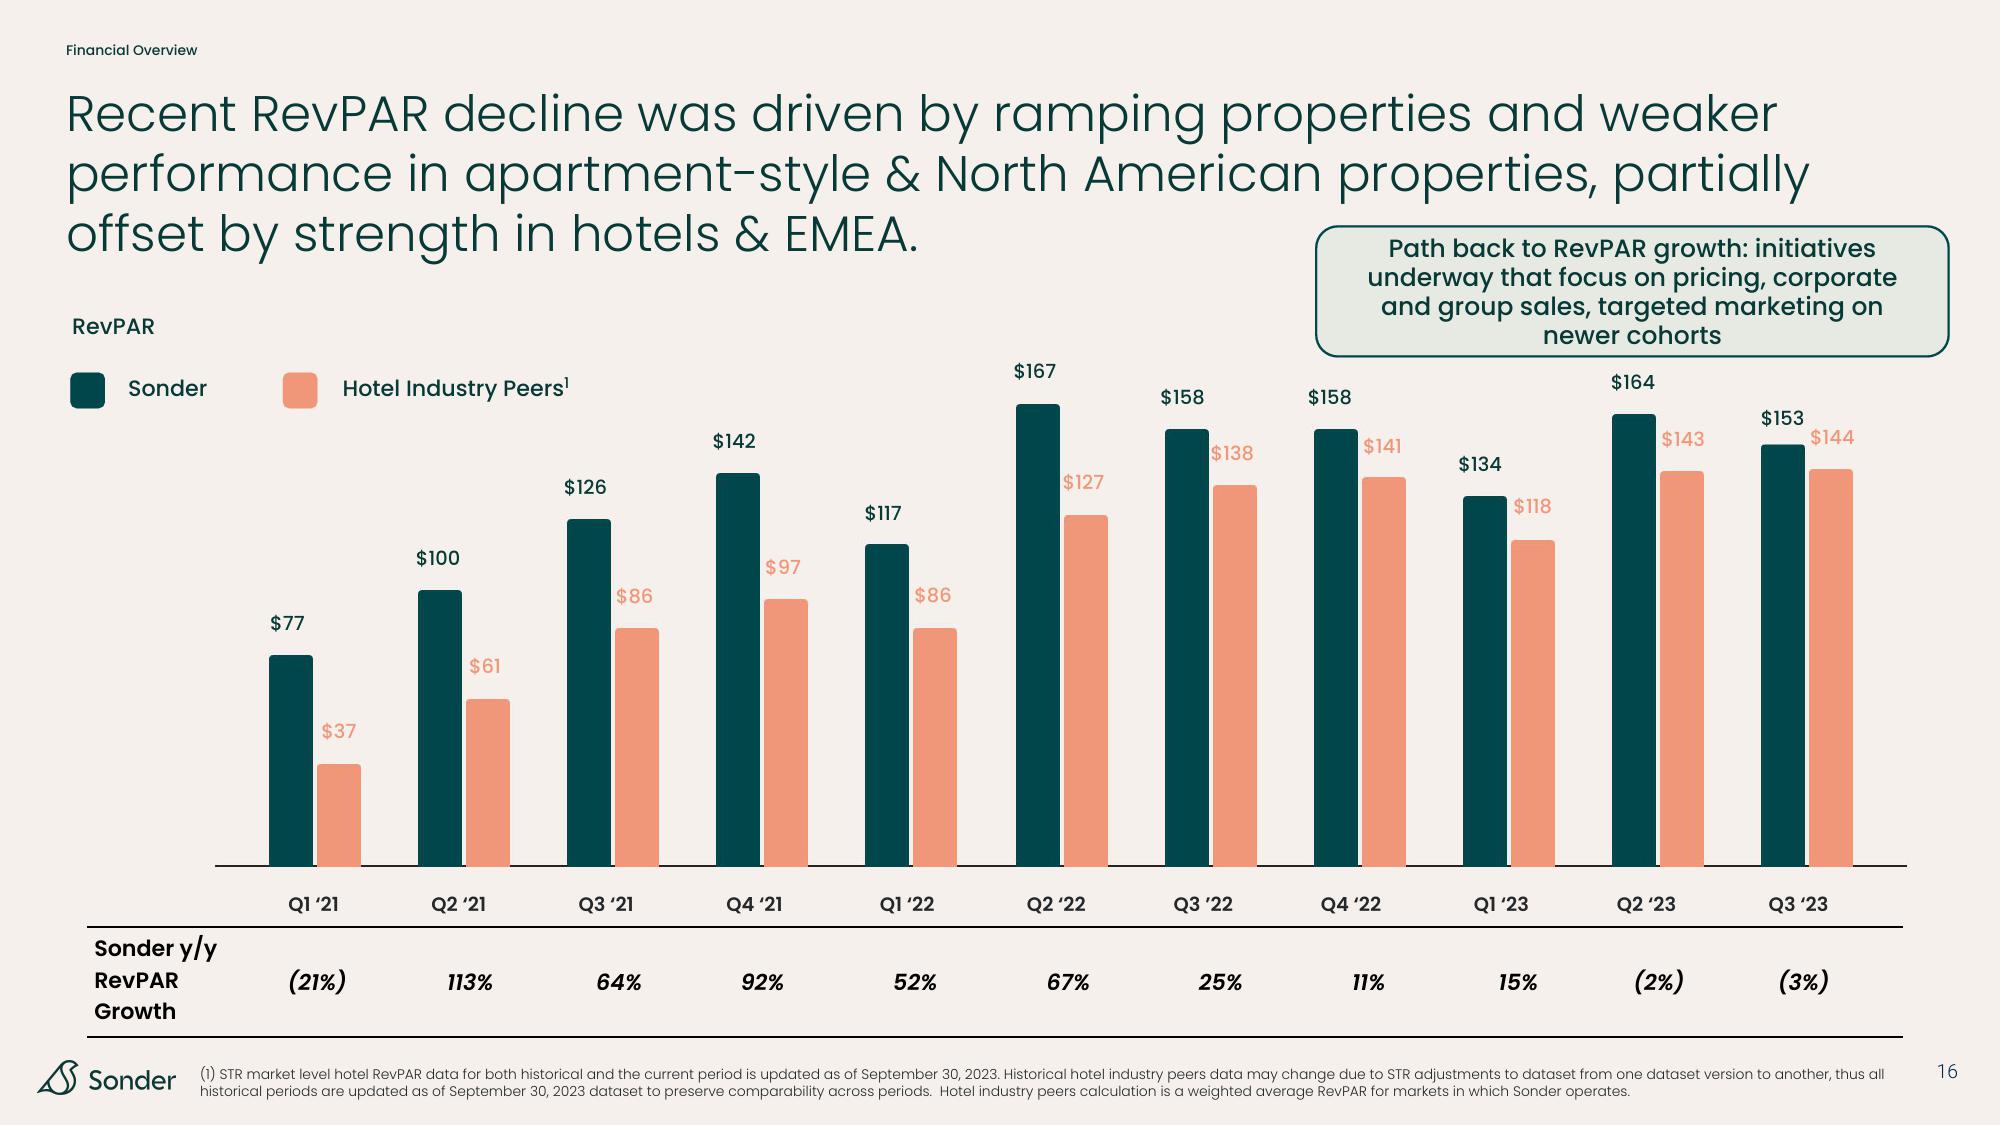
Recent RevPAR decline was driven by ramping properties and weaker
performance in apartment-style & North American properties, partially
offset by strength in hotels & EMEA.
RevPAR
Sonder
Sonder y/y
RevPAR
Growth
$77
Hotel Industry Peers¹
$37
Q1'21
(21%)
$100
$61
Q2 '21
113%
$126
$86
Q3 '21
64%
$142
$97
Q4 '21
92%
$117
$86
Q1'22
52%
$167
$127
Q2 '22
67%
$158
$138
Q3 '22
25%
$158
Path back to RevPAR growth: initiatives
underway that focus on pricing, corporate
and group sales, targeted marketing on
newer cohorts
$141
Q4 '22
11%
$134
$118
Q1'23
15%
$164
$143
Q2 '23
(2%)
$153
$144
Q3 '23
(3%)
Sonder (1) STR market level hotel RevPAR data for both historical and the current period is updated as of September 30, 2023. Historical hotel industry peers data may change due to STR adjustments to dataset from one dataset version to another, thus all
historical periods are updated as of September 30, 2023 dataset to preserve comparability across periods. Hotel industry peers calculation is a weighted average RevPAR for markets in which Sonder operates.
16View entire presentation