Dave SPAC Presentation Deck
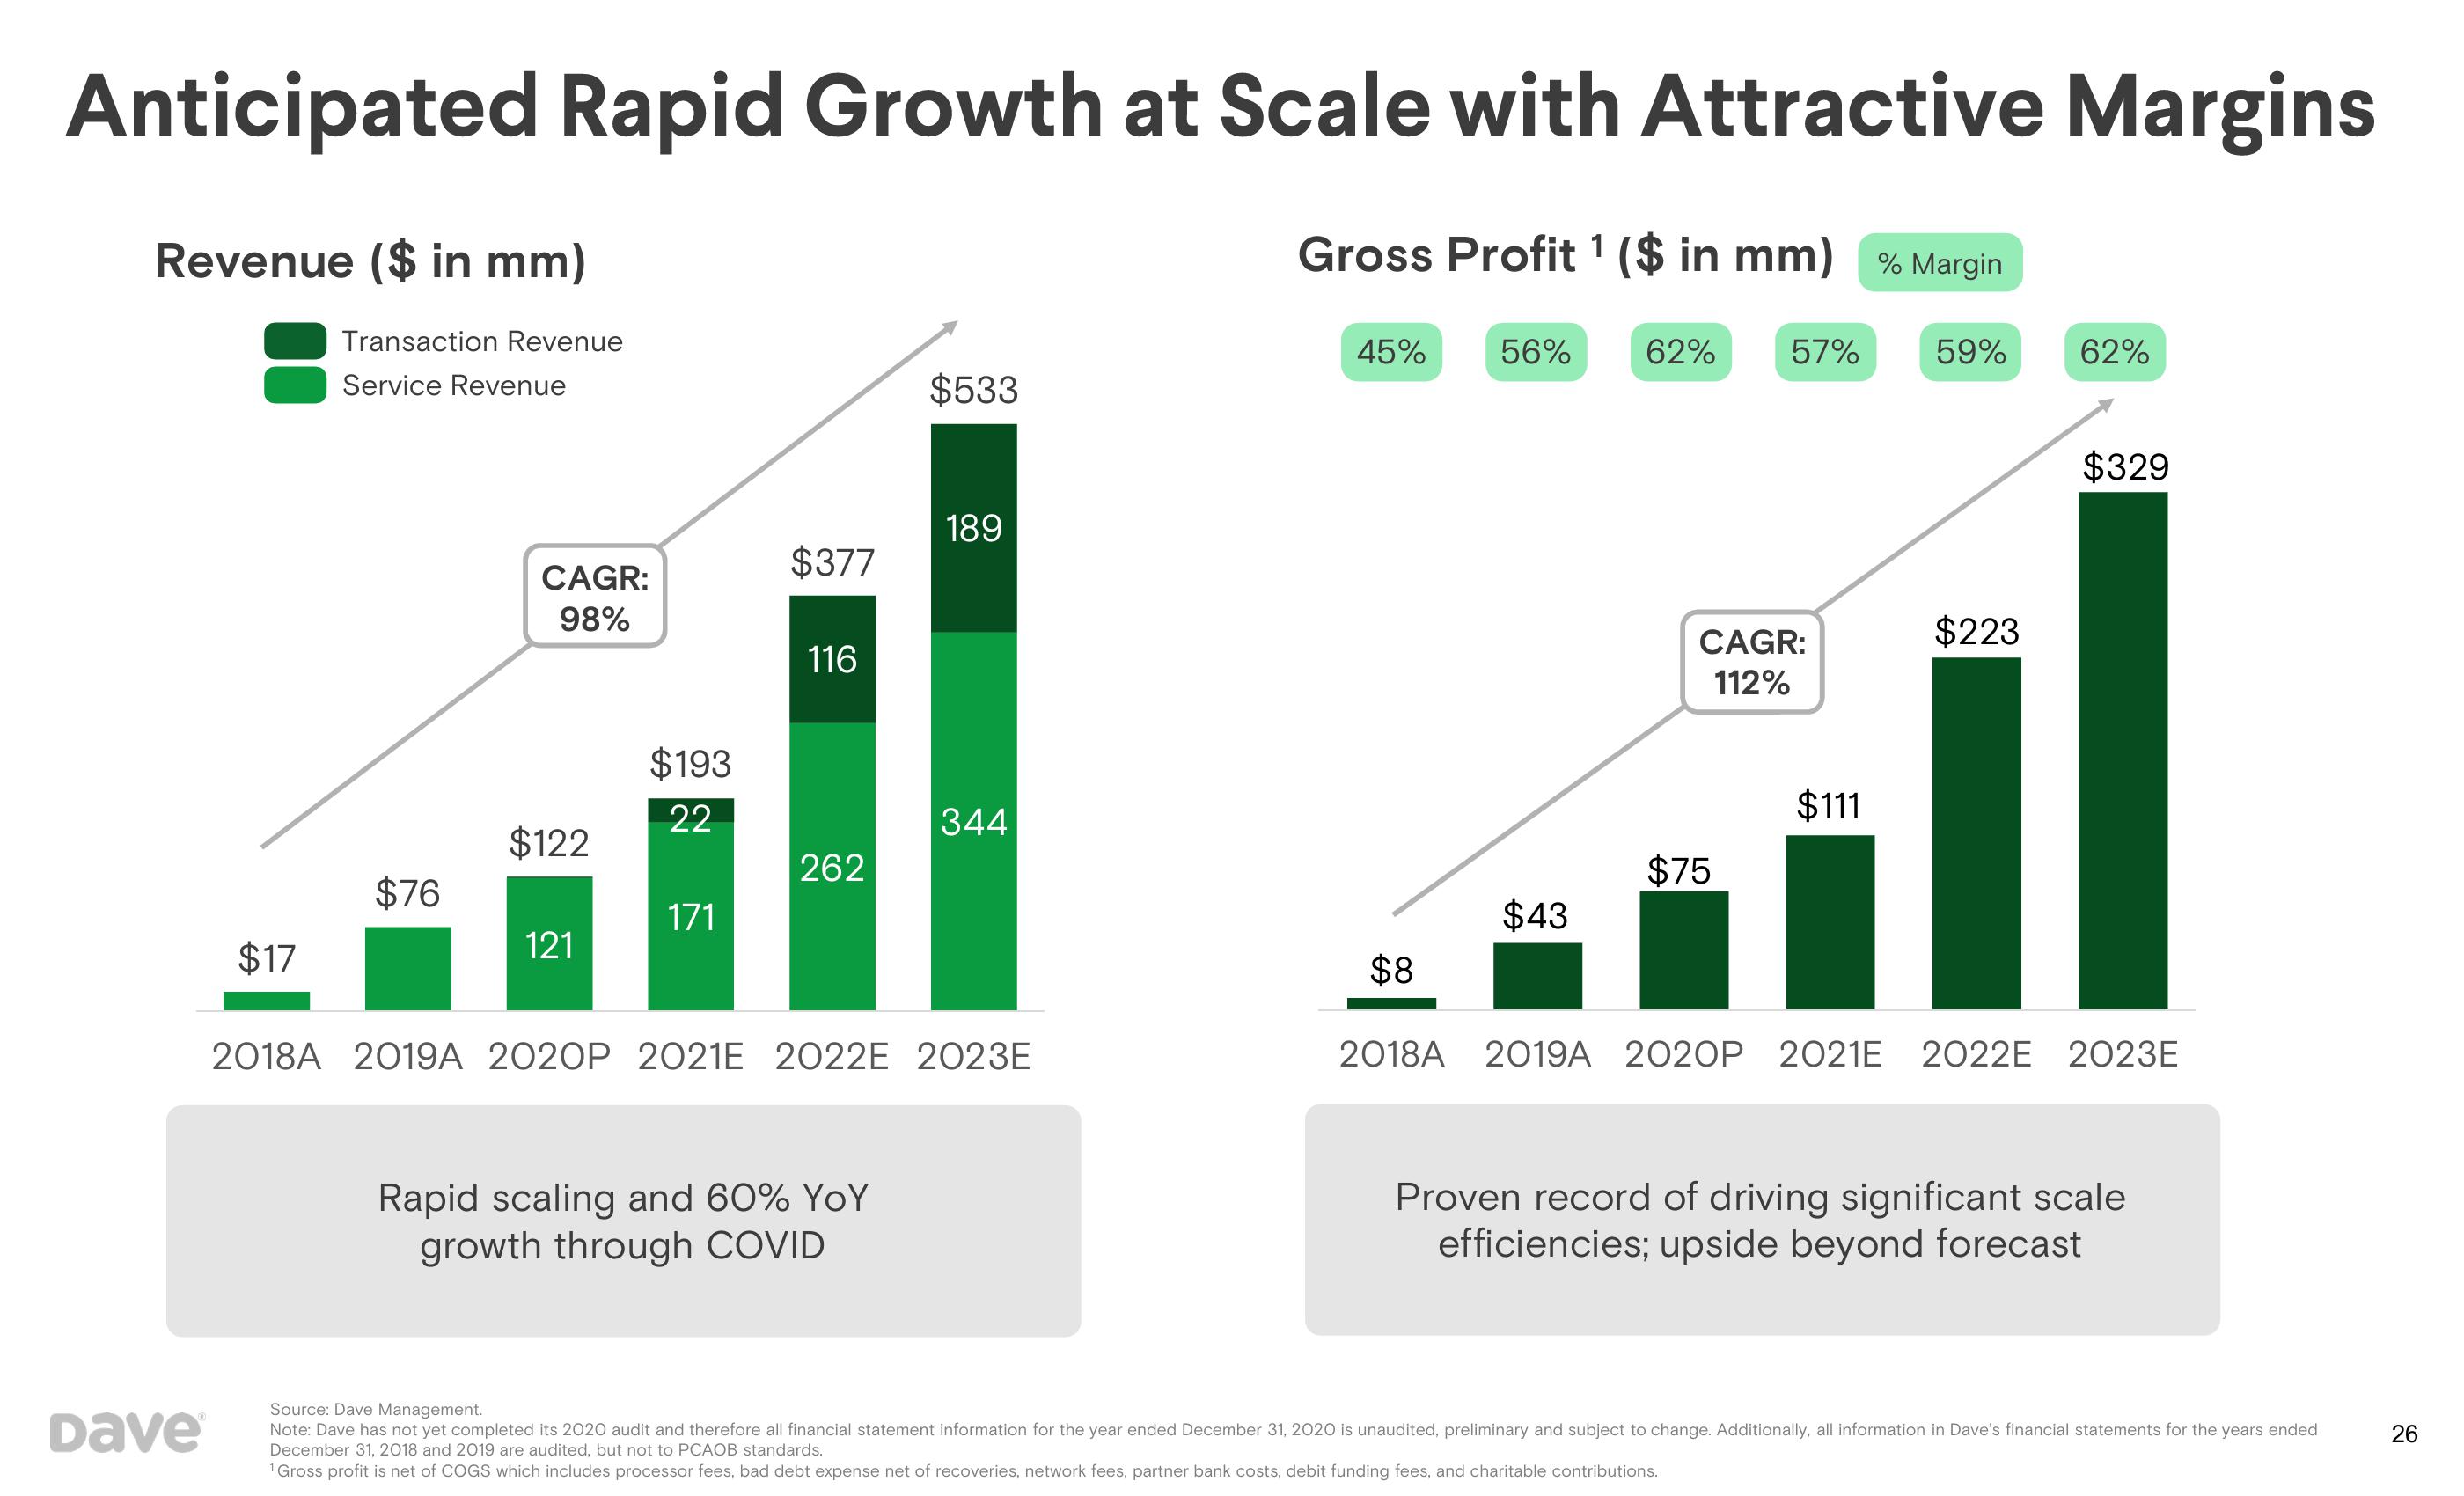
Anticipated Rapid Growth at Scale with Attractive Margins
Gross Profit ¹ ($ in mm) % Margin
1
Revenue ($ in mm)
Dave
$17
Transaction Revenue
Service Revenue
$76
CAGR:
98%
$122
121
$193
22
171
$377
116
262
$533
Rapid scaling and 60% YoY
growth through COVID
189
344
2018A 2019A 2020P 2021E 2022 2023E
45%
$8
56%
$43
62%
57%
CAGR:
112%
$75
$111
59% 62%
$223
$329
2018A 2019A 2020P 2021E 2022E 2023E
Proven record of driving significant scale
efficiencies; upside beyond forecast
Source: Dave Management.
Note: Dave has not yet completed its 2020 audit and therefore all financial statement information for the year ended December 31, 2020 is unaudited, preliminary and subject to change. Additionally, all information in Dave's financial statements for the years ended
December 31, 2018 and 2019 are audited, but not to PCAOB standards.
¹ Gross profit is net of COGS which includes processor fees, bad debt expense net of recoveries, network fees, partner bank costs, debit funding fees, and charitable contributions.
26View entire presentation