Zegna Results Presentation Deck
1H 2022 RESULTS - SUMMARY FIGURES
●
●
Reported
Non-IFRS
Measures
(Euro Million in Actual Fx)
Revenues
- Zegna segment
- Thom Browne segment
Profit
Basic earnings per share in Euro
Diluted earnings per share in Euro
Adjusted EBIT
% on Revenues
- Zegna segment
- Thom Browne segment
Adjusted Profit
Adjusted basic earnings per share
Adjusted diluted earnings per share
Net Financial Indebtedness/(Cash Surplus)
1H22
729.0
553.0
185.8
21.0
0.06
0.06
82.7
11.3%
51.1
31.6
22.8
0.07
0.07
(103.1)
1H21
603.3
465.9
142.6
32.2
0.14
0.14
66.8
11.1%
39.0
27.8
26.3
0.11
0.11
73.3
Ermenegildo Zegna Group
A€ vs 1H21
+125.7
+87.1
+43.2
(11.2)
(0.08)
(0.08)
+15.9
+12.1
+3.7
(3.5)
(0.04)
(0.04)
(176.4)
A% vs 1H21
+21%
+19%
+30%
(35%)
(58%)
(58%)
+24%
+31%
+13%
(13%)
(40%)
(40%)
n.s.
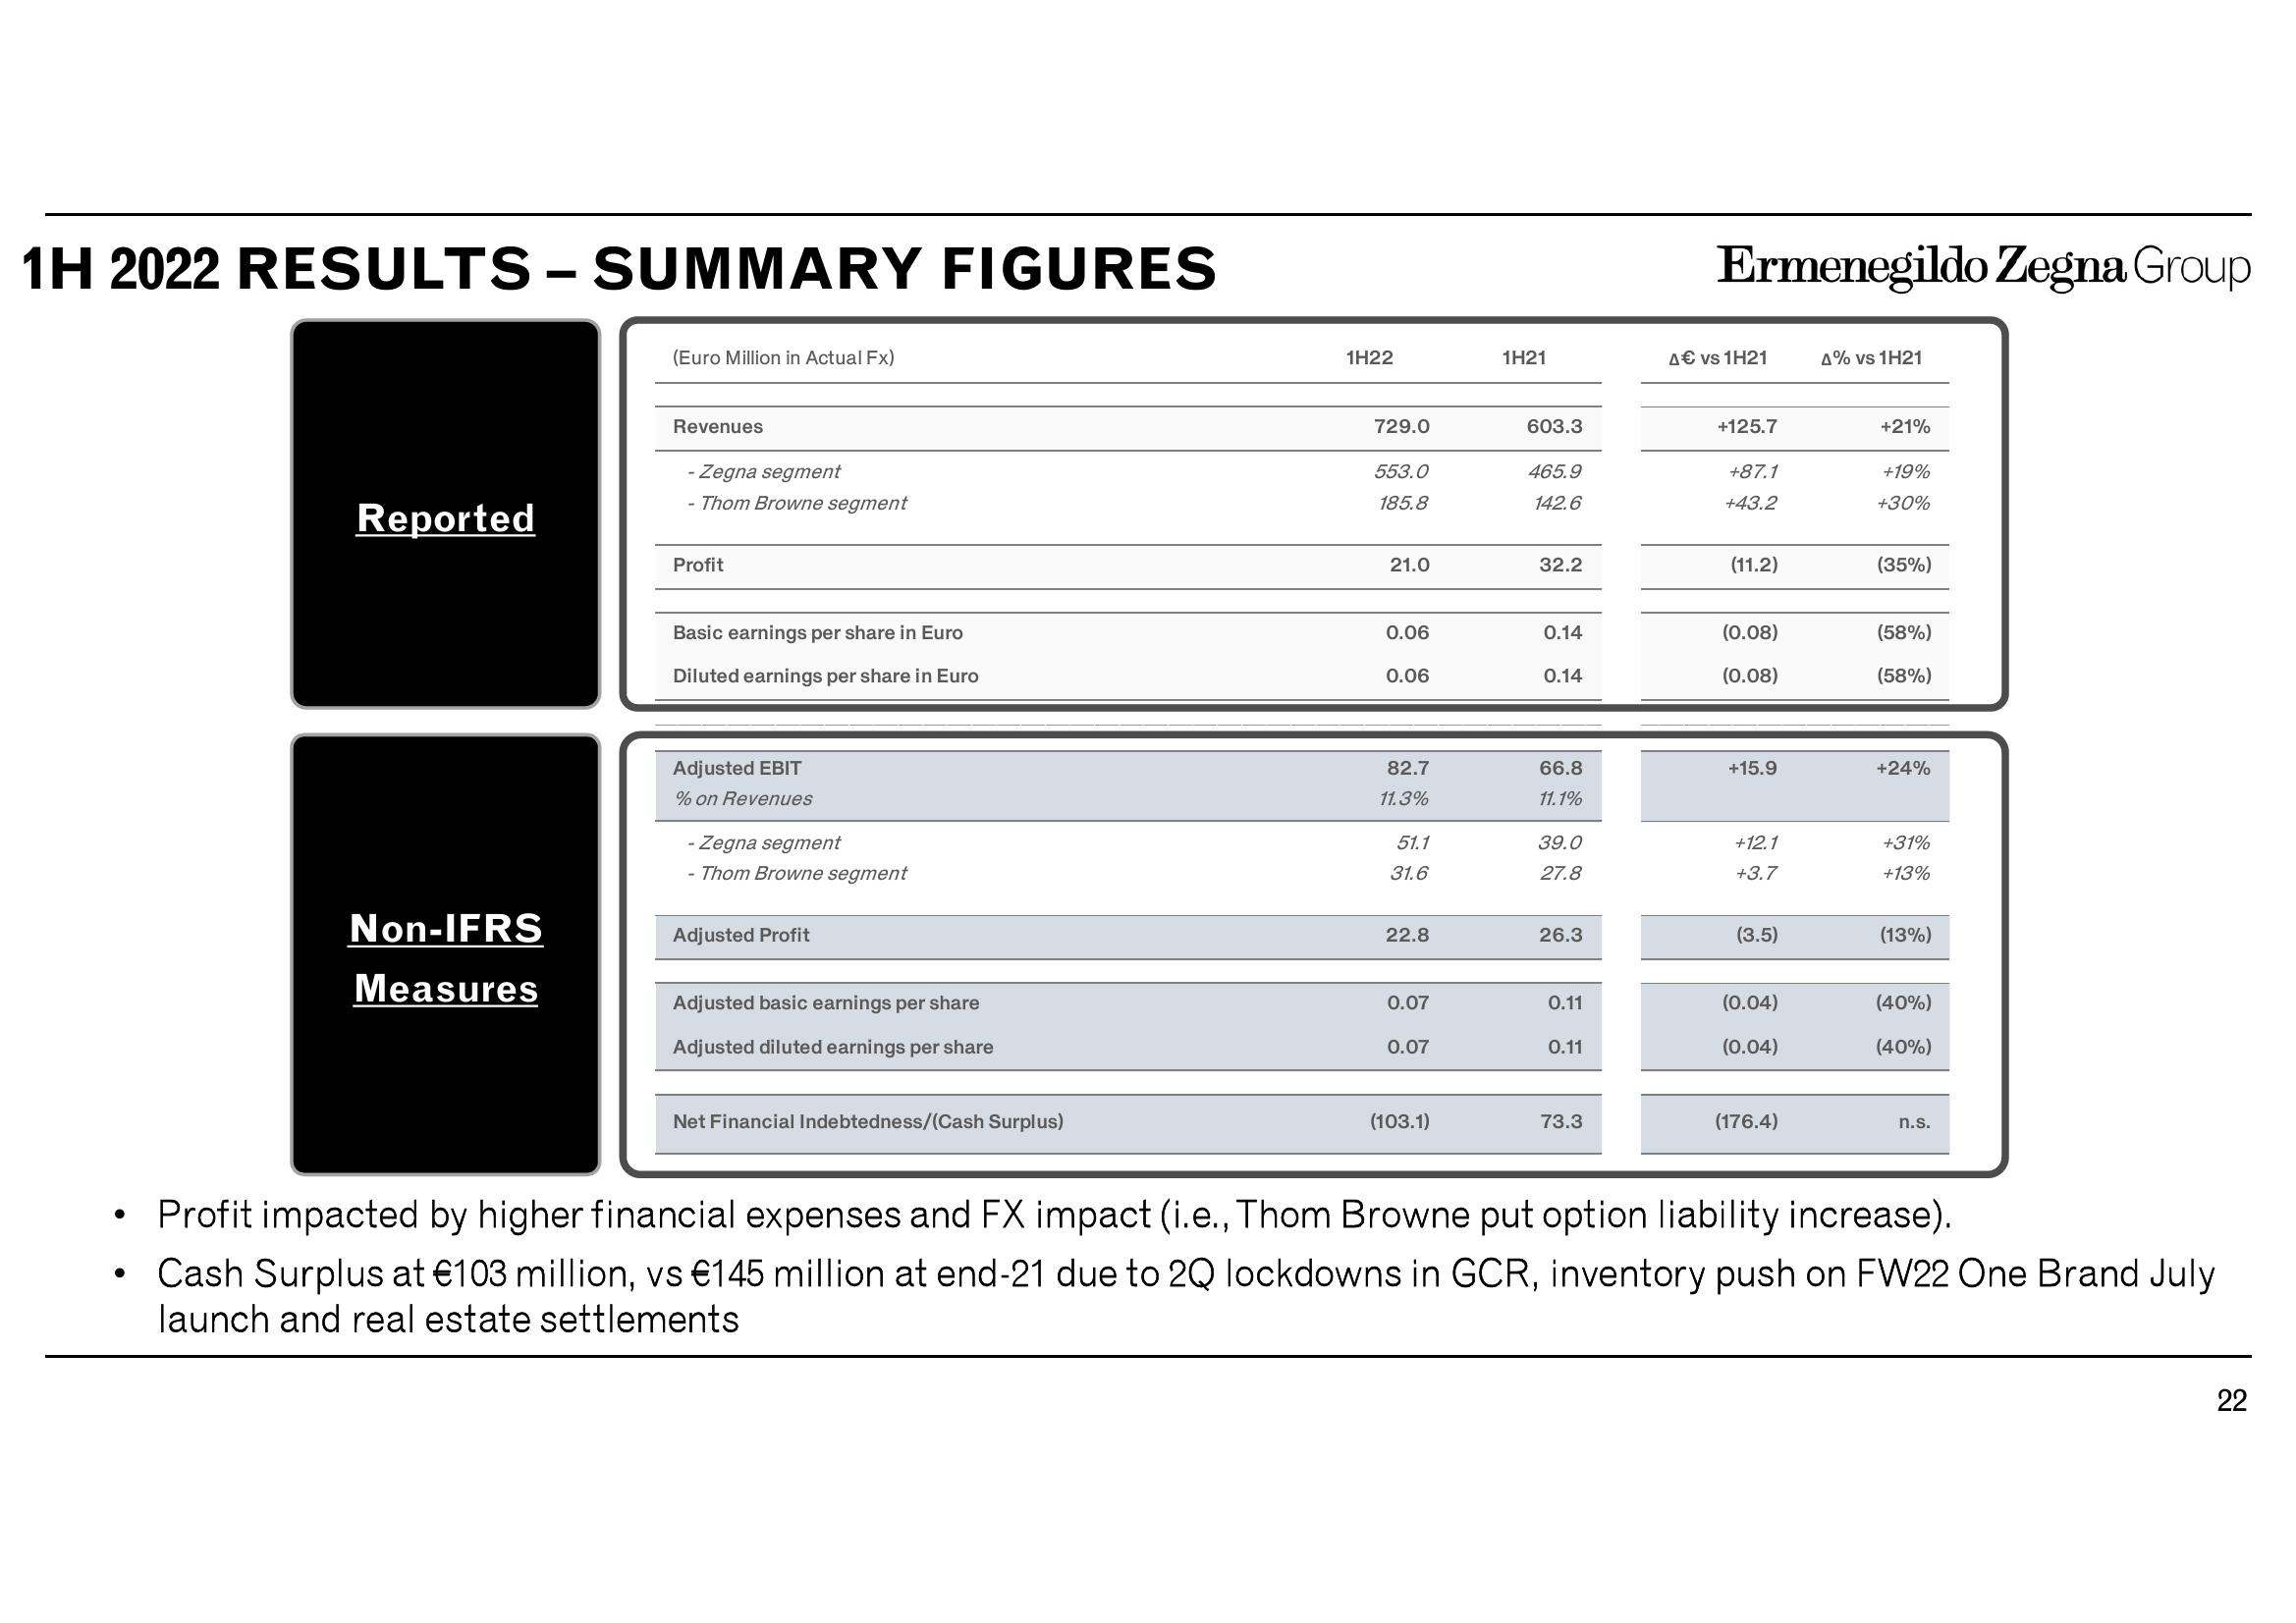
Profit impacted by higher financial expenses and FX impact (i.e., Thom Browne put option liability increase).
Cash Surplus at €103 million, vs €145 million at end-21 due to 2Q lockdowns in GCR, inventory push on FW22 One Brand July
launch and real estate settlements
22View entire presentation