Gogoro Investor Presentation Deck
Reconciliation of IFRS Financial Metrics to Non-IFRS
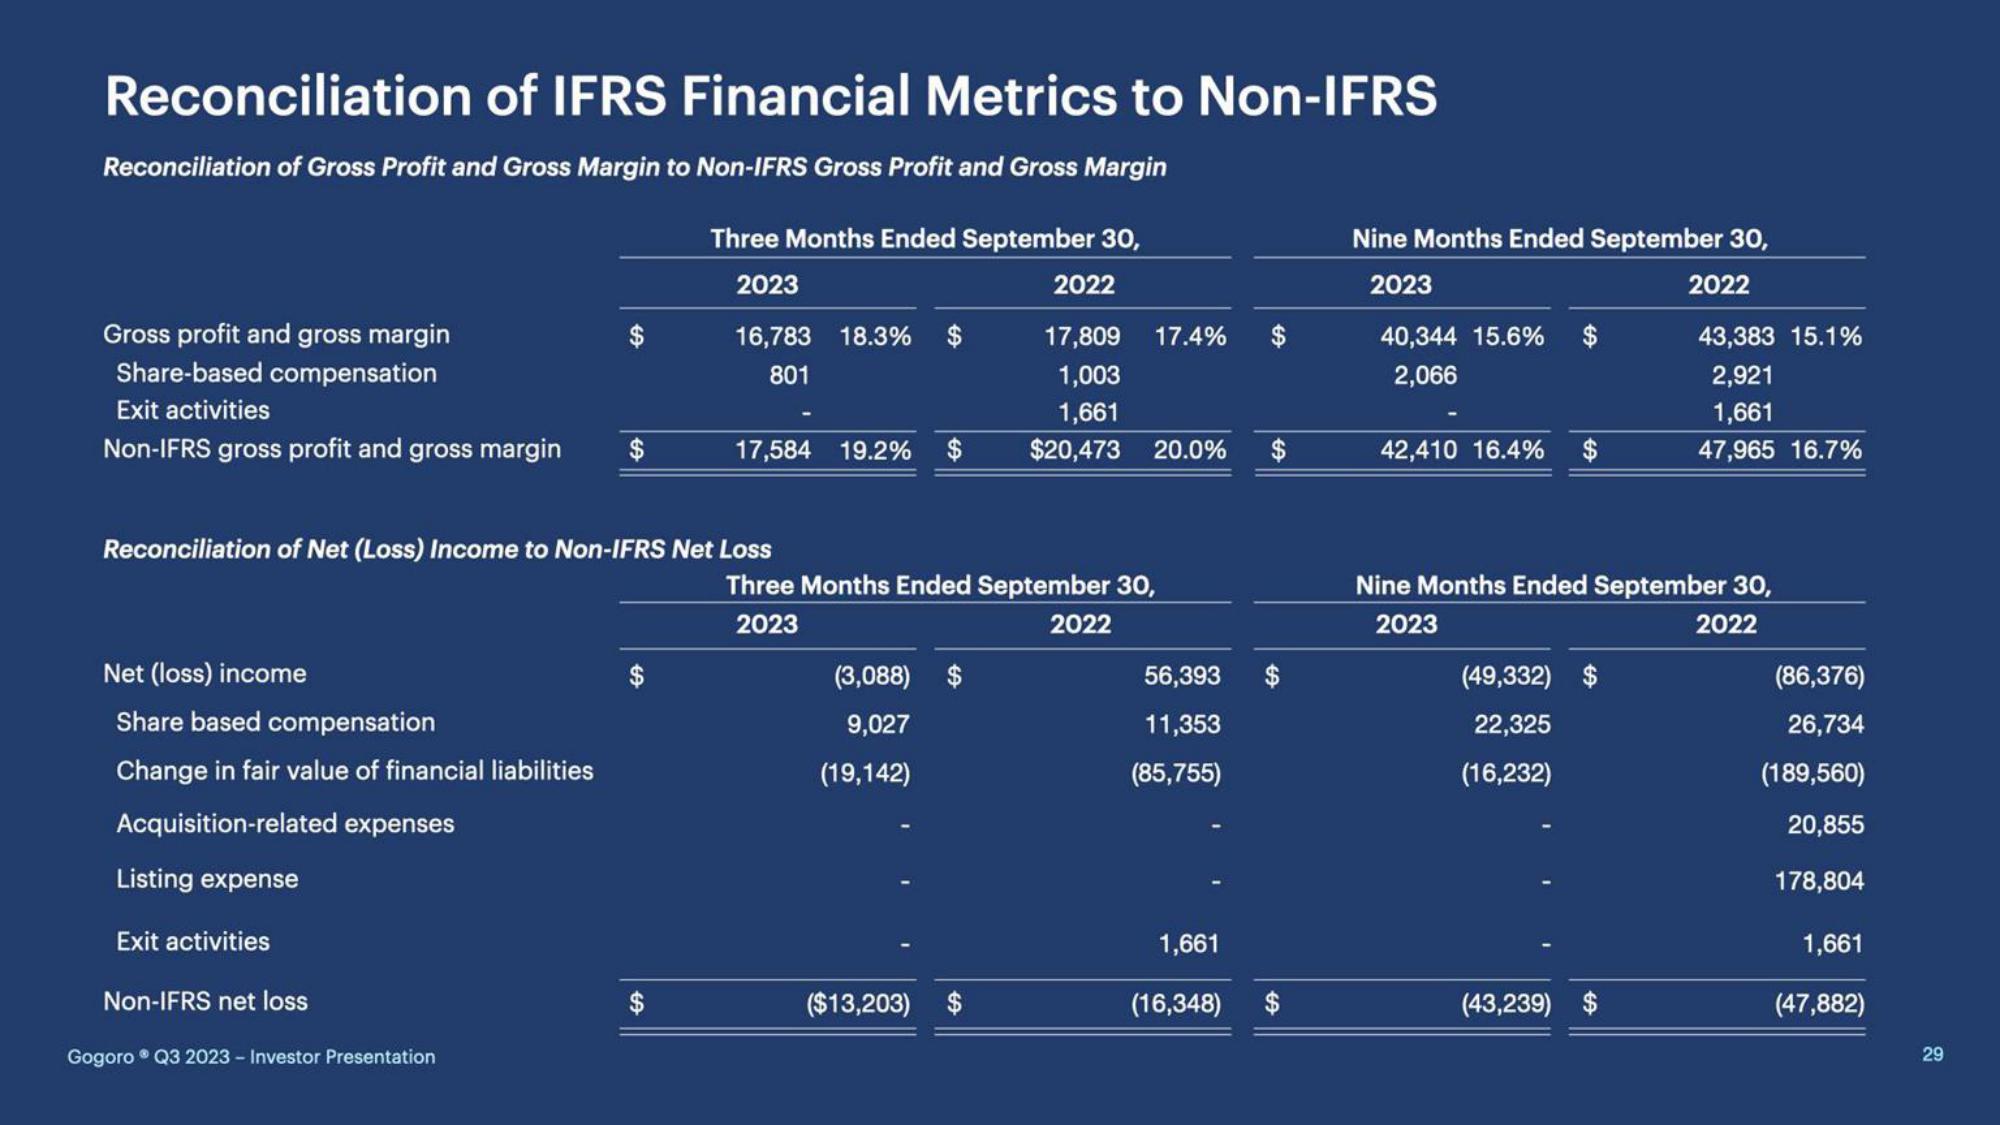
Reconciliation of Gross Profit and Gross Margin to Non-IFRS Gross Profit and Gross Margin
Gross profit and gross margin
Share-based compensation
Exit activities
Non-IFRS gross profit and gross margin
Net (loss) income
Share based compensation
Change in fair value of financial liabilities
Acquisition-related expenses
Listing expense
Exit activities
Non-IFRS net loss
Three Months Ended September 30,
2023
16,783 18.3% $
801
Reconciliation of Net (Loss) Income to Non-IFRS Net Loss
Gogoro Q3 2023 - Investor Presentation
17,584 19.2% $
Three Months Ended September 30,
2023
2022
(3,088) $
9,027
(19,142)
2022
17,809 17.4% $
1,003
1,661
$20,473 20.0% $
($13,203)
56,393
11,353
(85,755)
1,661
(16,348)
Nine Months Ended September 30,
2023
2022
40,344 15.6%
2,066
42,410 16.4%
$
Nine Months Ended September 30,
2023
2022
(49,332) $
22,325
(16,232)
43,383 15.1%
2,921
1,661
47,965 16.7%
(43,239) $
(86,376)
26,734
(189,560)
20,855
178,804
1,661
(47,882)
29View entire presentation