Morgan Stanley Investment Banking Pitch Book
Project Roosevelt
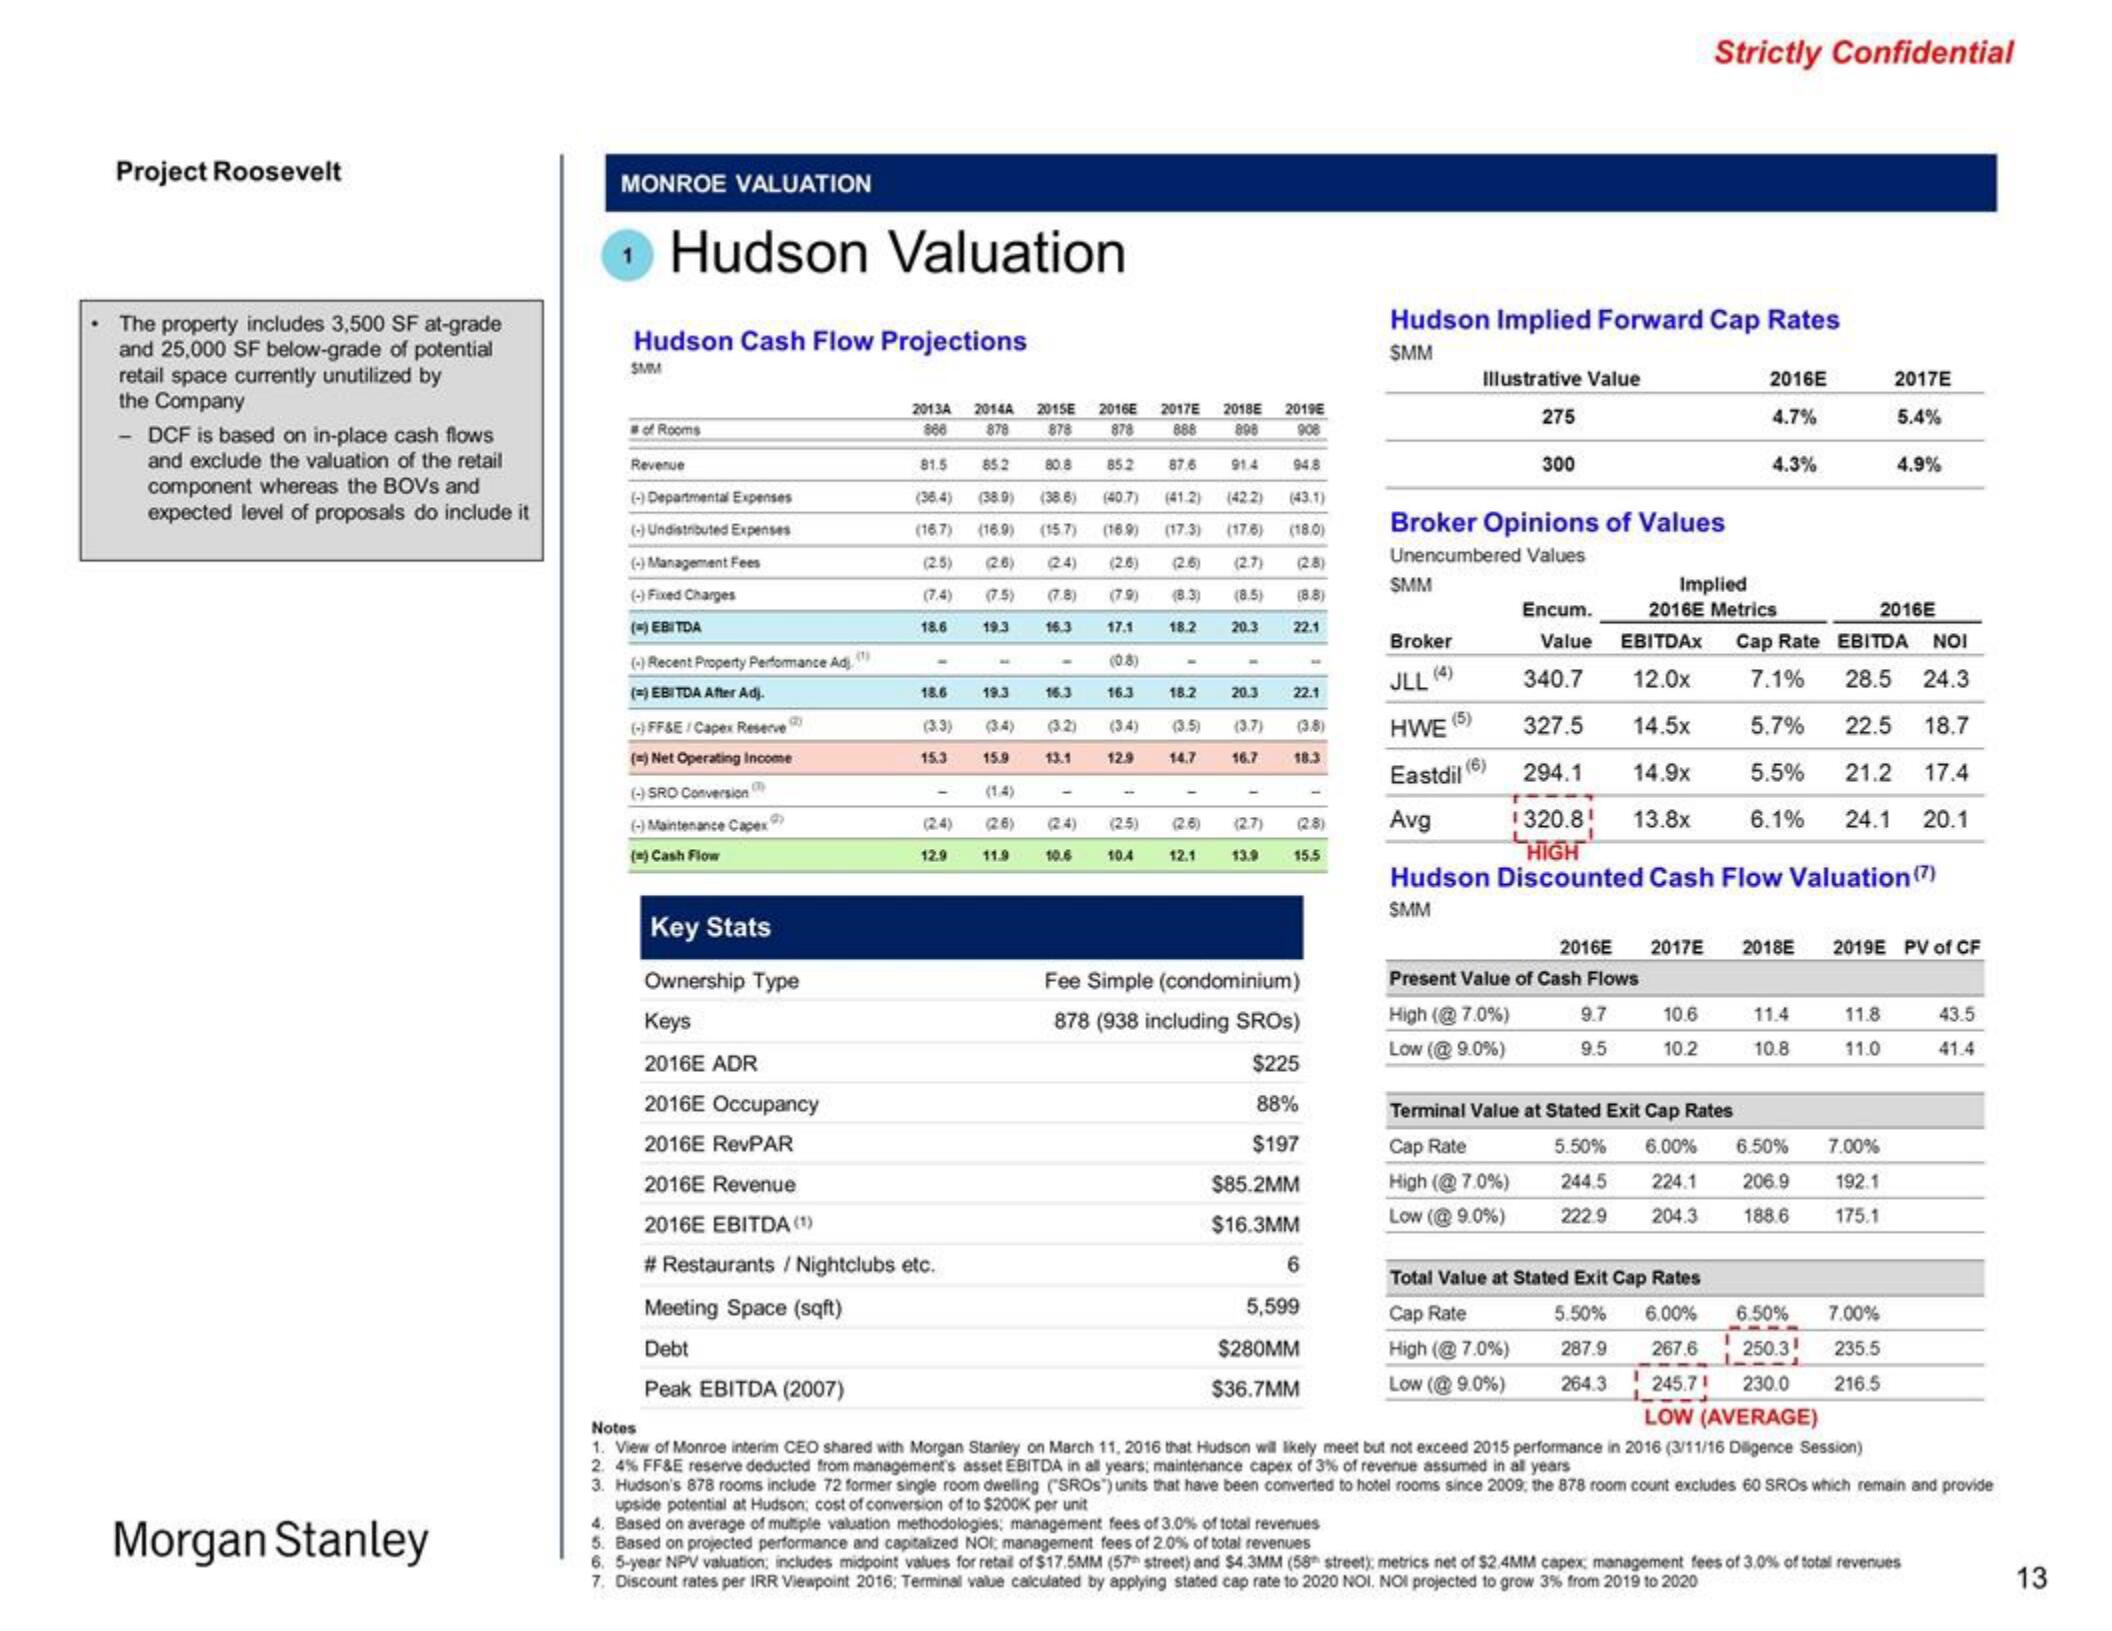
The property includes 3,500 SF at-grade
and 25,000 SF below-grade of potential
retail space currently unutilized by
the Company
- DCF is based on in-place cash flows
and exclude the valuation of the retail
component whereas the BOVS and
expected level of proposals do include it
Morgan Stanley
MONROE VALUATION
Hudson Valuation
Hudson Cash Flow Projections
SMM
of Rooms
Revenue
(-) Departmental Expenses
(-) Undistributed Expenses
(-)Management Fees
(-) Fixed Charges
(-) EBITDA
(1)
(-) Recent Property Performance Adj
(=) EBITDA After Adj.
(-) FF&E/Capex Reserve
(=) Net Operating Income
(-) SRO Conversion
(-) Maintenance Capex
(=) Cash Flow
2013A 2014A 2015E 2016E
888 878 878 878
Meeting Space (sqft)
Debt
Peak EBITDA (2007)
81.5
(16.7)
(2.5)
18.6
18.6
(3.3)
15.3
(24)
12.9
Key Stats
Ownership Type
Keys
2016E ADR
2016E Occupancy
2016E RevPAR
2016E Revenue
2016E EBITDA (¹)
# Restaurants / Nightclubs etc.
19.3
85.2 80.8
85.2
91.4 94.8
(38.9) (38.6) (40.7) (41.2) (42.2) (43.1)
(16.9) (15.7) (16.9) (17.3) (17.6) (18.0)
(26)
(26) (2.6) (2.7) (28)
(7.5) (7.8) (79) (8.3) (8.5) (8.8)
16.3 17.1 18.2 20.3 22.1
19.3
(0.8)
16.3 16.3
(3.2)
15.9
(1.4)
(26)
11.9
(24)
13.1
(24)
10.6
12.9
(25)
2017E
888
10.4
87.6
-
18.2
20.3
22.1
(3.5) (3.7) (3.8)
16.7
14.7
18.3
2018E 2019E
898 908
(2.6)
12.1
(2.7)
13.9
15.5
Fee Simple (condominium)
878 (938 including SROS)
$225
88%
$197
$85.2MM
$16.3MM
6
5,599
$280MM
$36.7MM
Hudson Implied Forward Cap Rates
SMM
Illustrative Value
SMM
275
300
Broker Opinions of Values
Unencumbered Values
(6)
Strictly Confidential
EBITDAX
12.0x
14.5x
14.9x
13.8x
Implied
2016E Metrics
Present Value of Cash Flows
10.6
High (@7.0%) 9.7
9.5 10.2
Low (@ 9.0%)
Cap Rate
High (@7.0%) 244.5
222.9
Low (@9.0%)
2016E
4.7%
Broker
(5)
Encum.
Value
JLL (4)
340.7
HWE
327.5
Eastdil 294.1
Avg
1320.8!
HIGH
Hudson Discounted Cash Flow Valuation (7)
SMM
Terminal Value at Stated Exit Cap Rates
4.3%
2016E 2017E 2018E
Total Value at Stated Exit Cap Rates
Cap Rate
High (@ 7.0%)
Low (@ 9.0%)
5.50% 6.00%
287.9
264.3
11.4
10.8
5.50% 6.00% 6.50%
224.1 206.9
204.3 188.6
Cap Rate EBITDA NOI
28.5 24.3
7.1%
5.7% 22.5 18.7
5.5% 21.2 17.4
6.1% 24.1 20.1
2017E
5.4%
2016E
4.9%
11.8
11.0
7.00%
2019E PV of CF
192.1
175.1
43.5
41.4
6.50% 7.00%
267.6 250.31 235.5
245.71 230.0
LOW (AVERAGE)
216.5
Notes
1. View of Monroe interim CEO shared with Morgan Stanley on March 11, 2016 that Hudson will likely meet but not exceed 2015 performance in 2016 (3/11/16 Diligence Session)
2. 4% FF&E reserve deducted from management's asset EBITDA in all years; maintenance capex of 3% of revenue assumed in all years
3. Hudson's 878 rooms include 72 former single room dwelling ("SROS") units that have been converted to hotel rooms since 2009, the 878 room count excludes 60 SROS which remain and provide
upside potential at Hudson; cost of conversion of to $200K per unit
4. Based on average of multiple valuation methodologies; management fees of 3.0% of total revenues
5. Based on projected performance and capitalized NOI, management fees of 2.0% of total revenues
6. 5-year NPV valuation, includes midpoint values for retail of $17.5MM (57 street) and $4.3MM (58 street); metrics net of $2,4MM capex management fees of 3.0% of total revenues
7. Discount rates per IRR Viewpoint 2016: Terminal value calculated by applying stated cap rate to 2020 NOI, NOI projected to grow 3% from 2019 to 2020
13View entire presentation