Nexters Results Presentation Deck
Diversification across key platforms and geographies
$m
Bookings By Platform (¹)
Mobile
Desktop
8
112
65%
35%
Q1 2021
+13%
127
64%
36%
Q1 2022
YoY
12%
15%
Source: Company information
1) For platform and geography splits corresponding shares in management accounts were used
$m
Bookings By Geography (¹)
US
Europe
Asia
112
33%
24%
21%
13%
9%
Q1 2021
+13%
FSU
127
31%
21%
28%
10%
10%
Q1 2022
Other
YoY
5%
0%
49%
-13%
30%
nexters
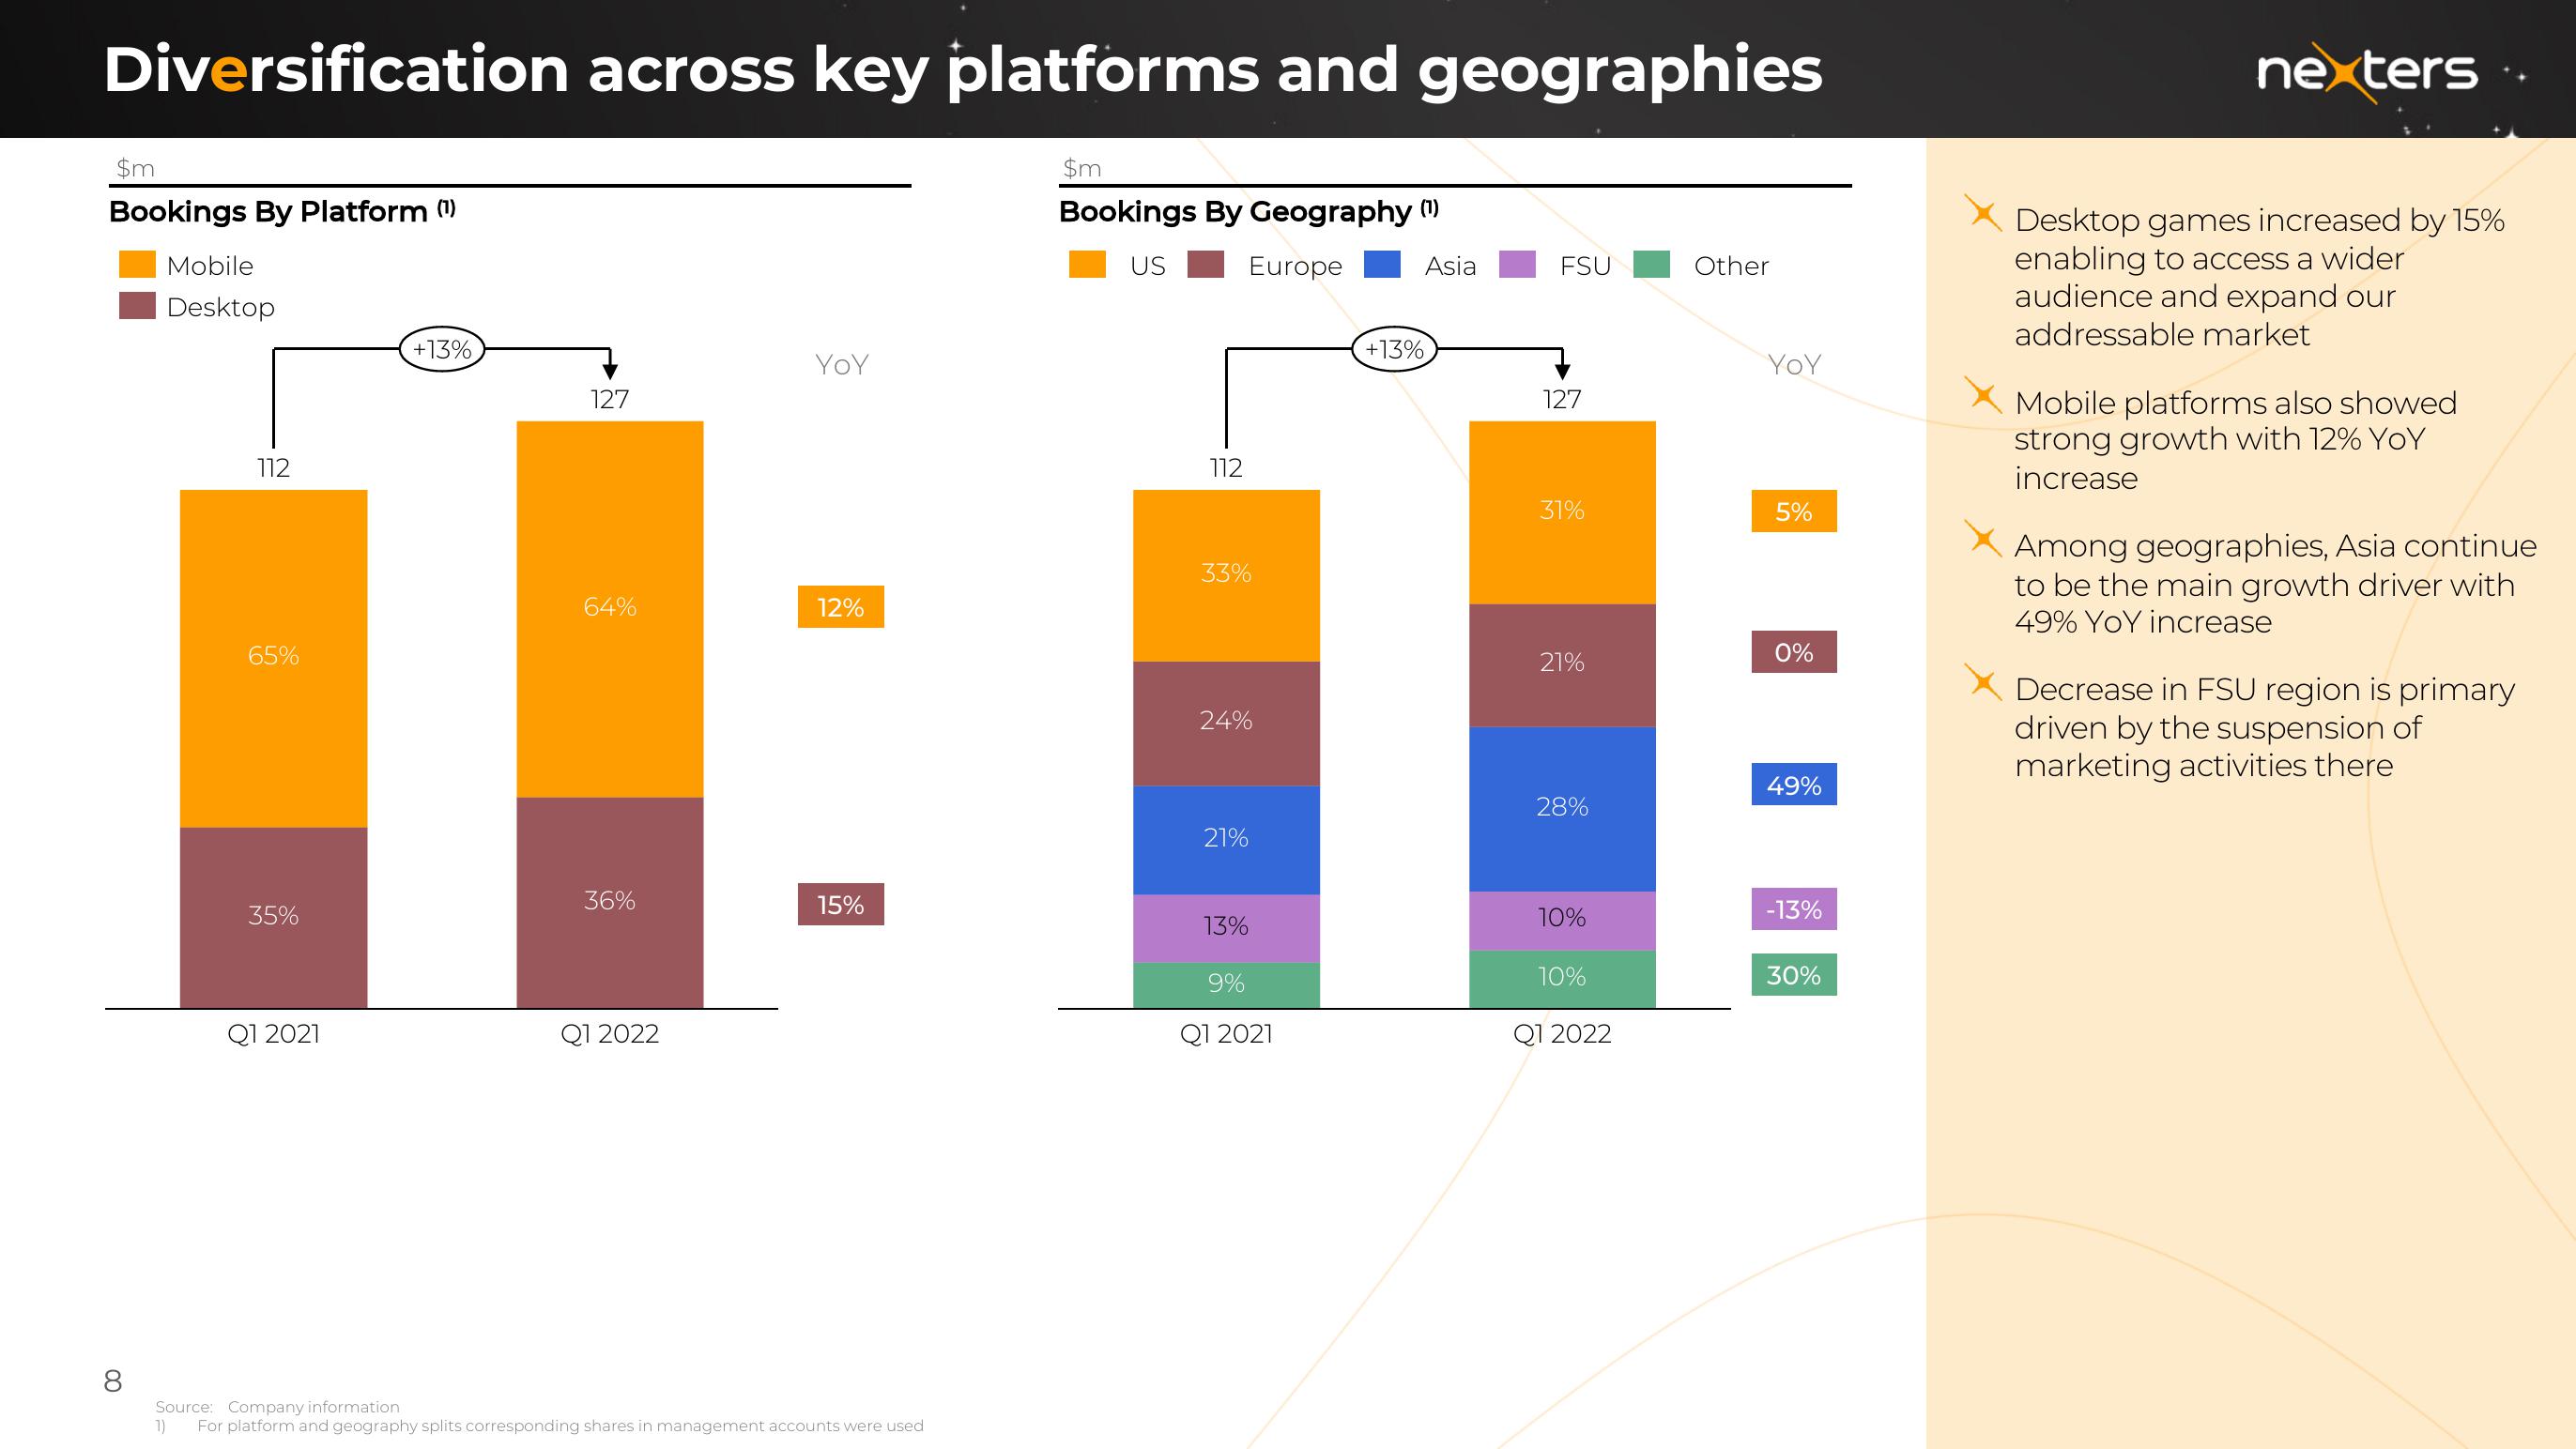
Desktop games increased by 15%
enabling to access a wider
audience and expand our
addressable market
Mobile platforms also showed
strong growth with 12% YoY
increase
Among geographies, Asia continue
to be the main growth driver with
49% YoY increase
Decrease in FSU region is primary
driven by the suspension of
marketing activities thereView entire presentation