Informatica Investor Day Presentation Deck
GAAP to Non-GAAP Reconciliations
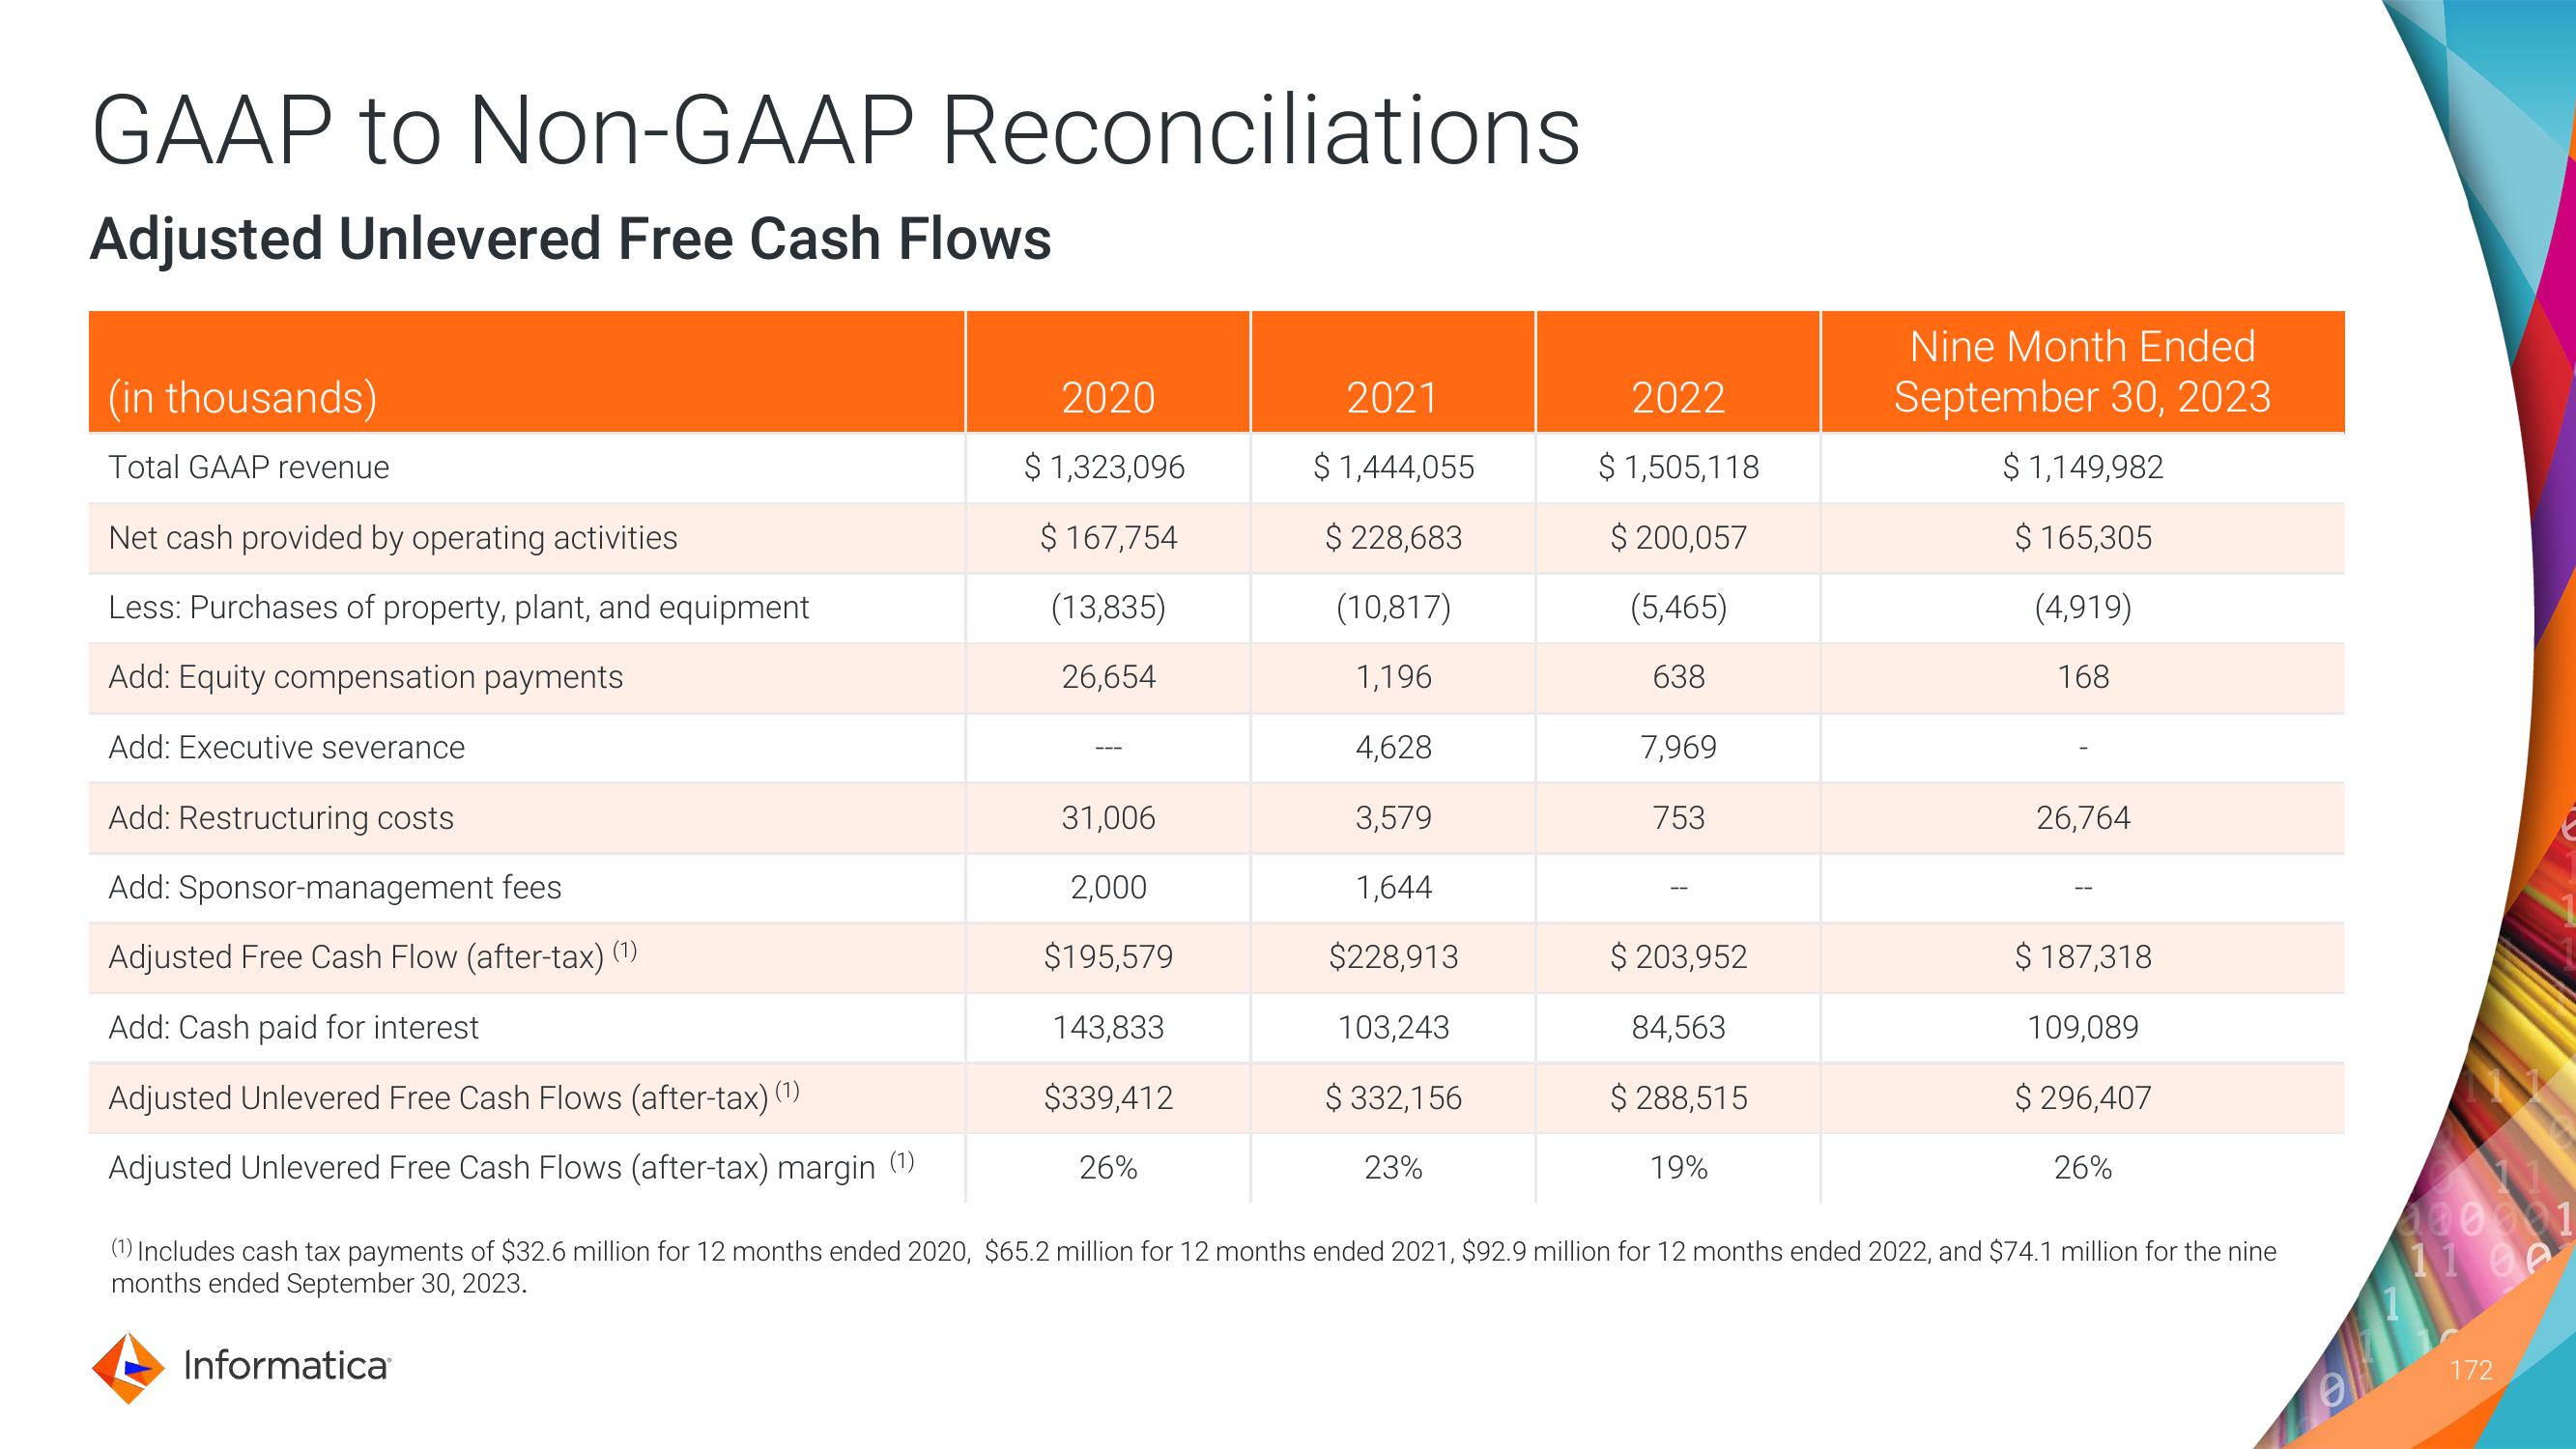
Adjusted Unlevered Free Cash Flows
(in thousands)
Total GAAP revenue
Net cash provided by operating activities
Less: Purchases of property, plant, and equipment
Add: Equity compensation payments
Add: Executive severance
Add: Restructuring costs
Add: Sponsor-management fees
Adjusted Free Cash Flow (after-tax) (1)
Add: Cash paid for interest
Adjusted Unlevered Free Cash Flows (after-tax) (1)
Adjusted Unlevered Free Cash Flows (after-tax) margin (¹)
2020
$ 1,323,096
$ 167,754
(13,835)
26,654
Informatica
31,006
2,000
$195,579
143,833
$339,412
26%
2021
$ 1,444,055
$ 228,683
(10,817)
1,196
4,628
3,579
1,644
$228,913
103,243
$ 332,156
23%
2022
$1,505,118
$ 200,057
(5,465)
638
7,969
753
$203,952
84,563
$288,515
19%
Nine Month Ended
September 30, 2023
$ 1,149,982
$ 165,305
(4,919)
168
26,764
$ 187,318
109,089
$ 296,407
26%
(1) Includes cash tax payments of $32.6 million for 12 months ended 2020, $65.2 million for 12 months ended 2021, $92.9 million for 12 months ended 2022, and $74.1 million for the nine
months ended September 30, 2023.
11
100001
11 00
172View entire presentation