Barclays Credit Presentation Deck
STRATEGY, TARGETS
& GUIDANCE
Income
£2.6bn
Q420: £2.6bn
Cost: income
ratio
65%
Q420: 69%
PBT
£1.0bn
Q420: £0.8bn
Average
equity¹
£28.7bn
Q420: £26.3bn
PERFORMANCE
RWAS
£200.7bn
Sep-21:
£192.5bn
Costs
£1.7bn
Q420: £1.8bn
Q421 Barclays International: Corporate & Investment Bank
ROTE of 10.2%, with improved profitability driven by stable income performance and a net impairment release
Impairment
£(73)m
release
Q420: £52m
charge
ROTE
10.2%
Q420: 6.3%
Total assets
£979bn
Sep-21:
£1,011bn
●
25 | Barclays Q4 2021 Results | 23 February 2022
●
●
●
●
ASSET QUALITY
●
CAPITAL
& LEVERAGE
MREL, FUNDING
& LIQUIDITY
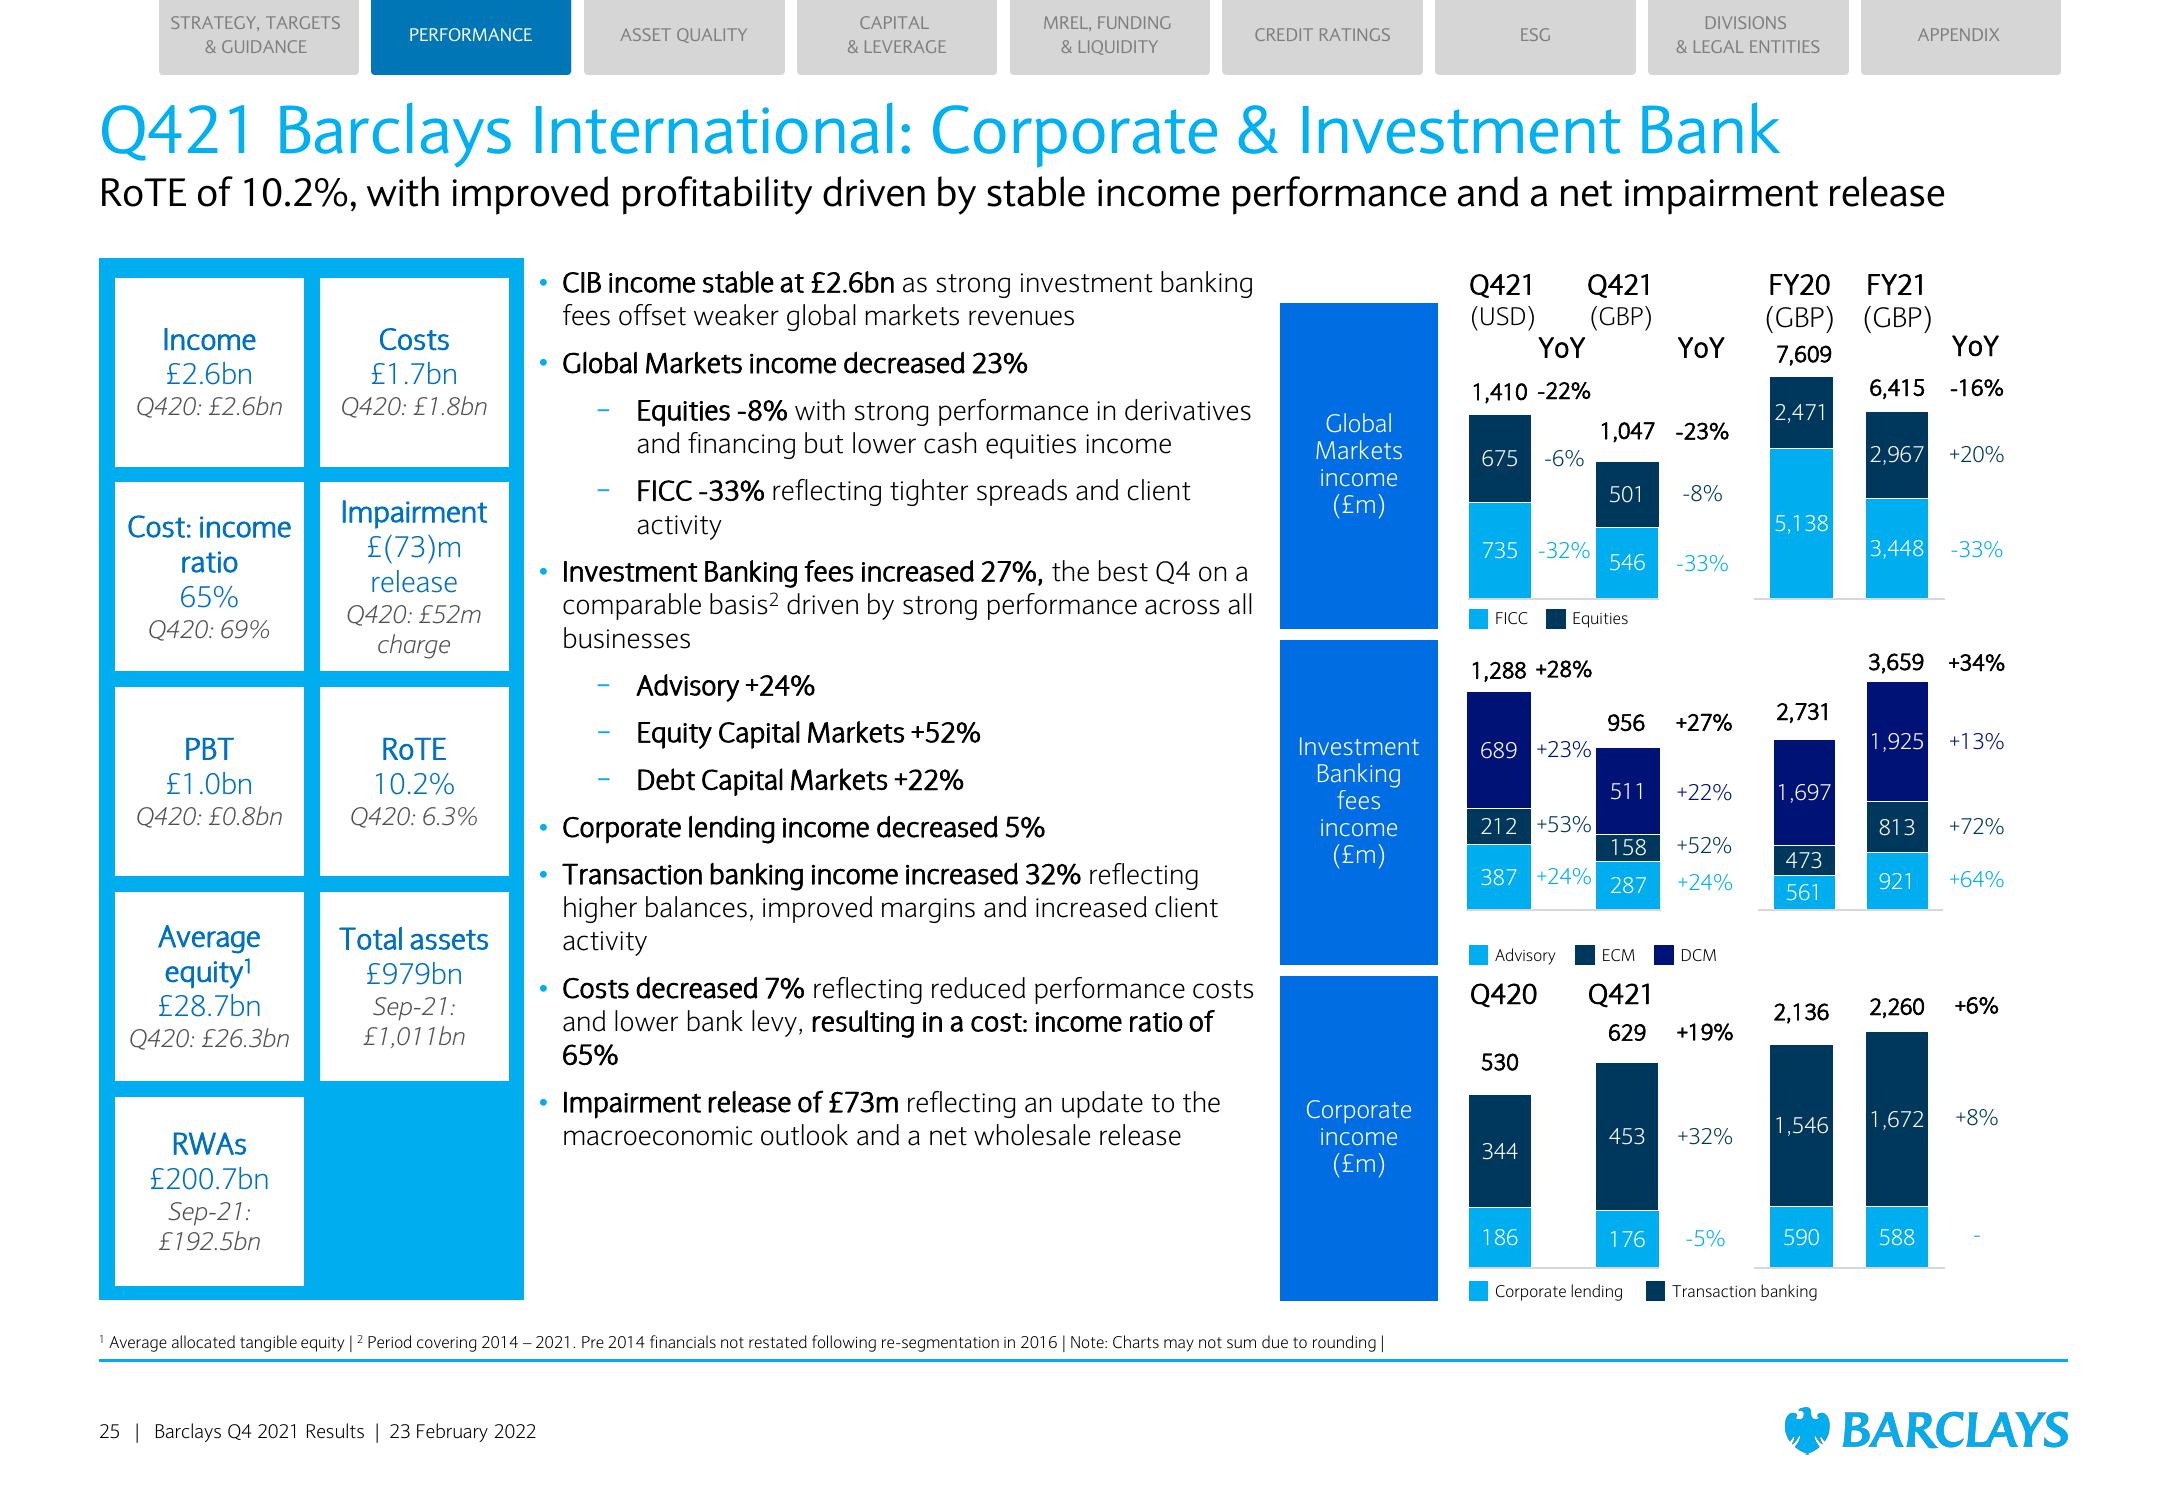
CIB income stable at £2.6bn as strong investment banking
fees offset weaker global markets revenues
Global Markets income decreased 23%
Equities -8% with strong performance in derivatives
and financing but lower cash equities income
FICC -33% reflecting tighter spreads and client
activity
Investment Banking fees increased 27%, the best Q4 on a
comparable basis² driven by strong performance across all
businesses
Advisory +24%
Equity Capital Markets +52%
Debt Capital Markets +22%
Corporate lending income decreased 5%
Transaction banking income increased 32% reflecting
higher balances, improved margins and increased client
activity
CREDIT RATINGS
Costs decreased 7% reflecting reduced performance costs
and lower bank levy, resulting in a cost: income ratio of
65%
Impairment release of £73m reflecting an update to the
macroeconomic outlook and a net wholesale release
Global
Markets
income
(£m)
Investment
Banking
fees
income
(£m)
Corporate
income
(£m)
Average allocated tangible equity | 2 Period covering 2014-2021. Pre 2014 financials not restated following re-segmentation in 2016 | Note: Charts may not sum due to rounding |
Q421 Q421
(USD) (GBP)
ESG
YoY
1,410 -22%
675 -6%
735 -32%
1,288 +28%
689 +23%
FICC Equities
212 +53%
387 +24%
Advisory
Q420
530
344
186
1,047 -23%
501 -8%
DIVISIONS
& LEGAL ENTITIES
546 -33%
YoY
956 +27%
511 +22%
ECM
Q421
158 +52%
287 +24%
453
176
629 +19%
Corporate lending
DCM
+32%
-5%
FY20 FY21
(GBP) (GBP)
7,609
2,471
5,138
2,731
1,697
473
561
APPENDIX
1,546
590
Transaction banking
YoY
6,415 -16%
2,967 +20%
3,448 -33%
3,659 +34%
1,925 +13%
2,136 2,260 +6%
813 +72%
921 +64%
1,672 +8%
588
BARCLAYSView entire presentation