Rally SPAC Presentation Deck
Transit participation exceeds pre-pandemic levels
Data suggests that global transit participation rebounds quickly from spikes in new Covid-19 cases
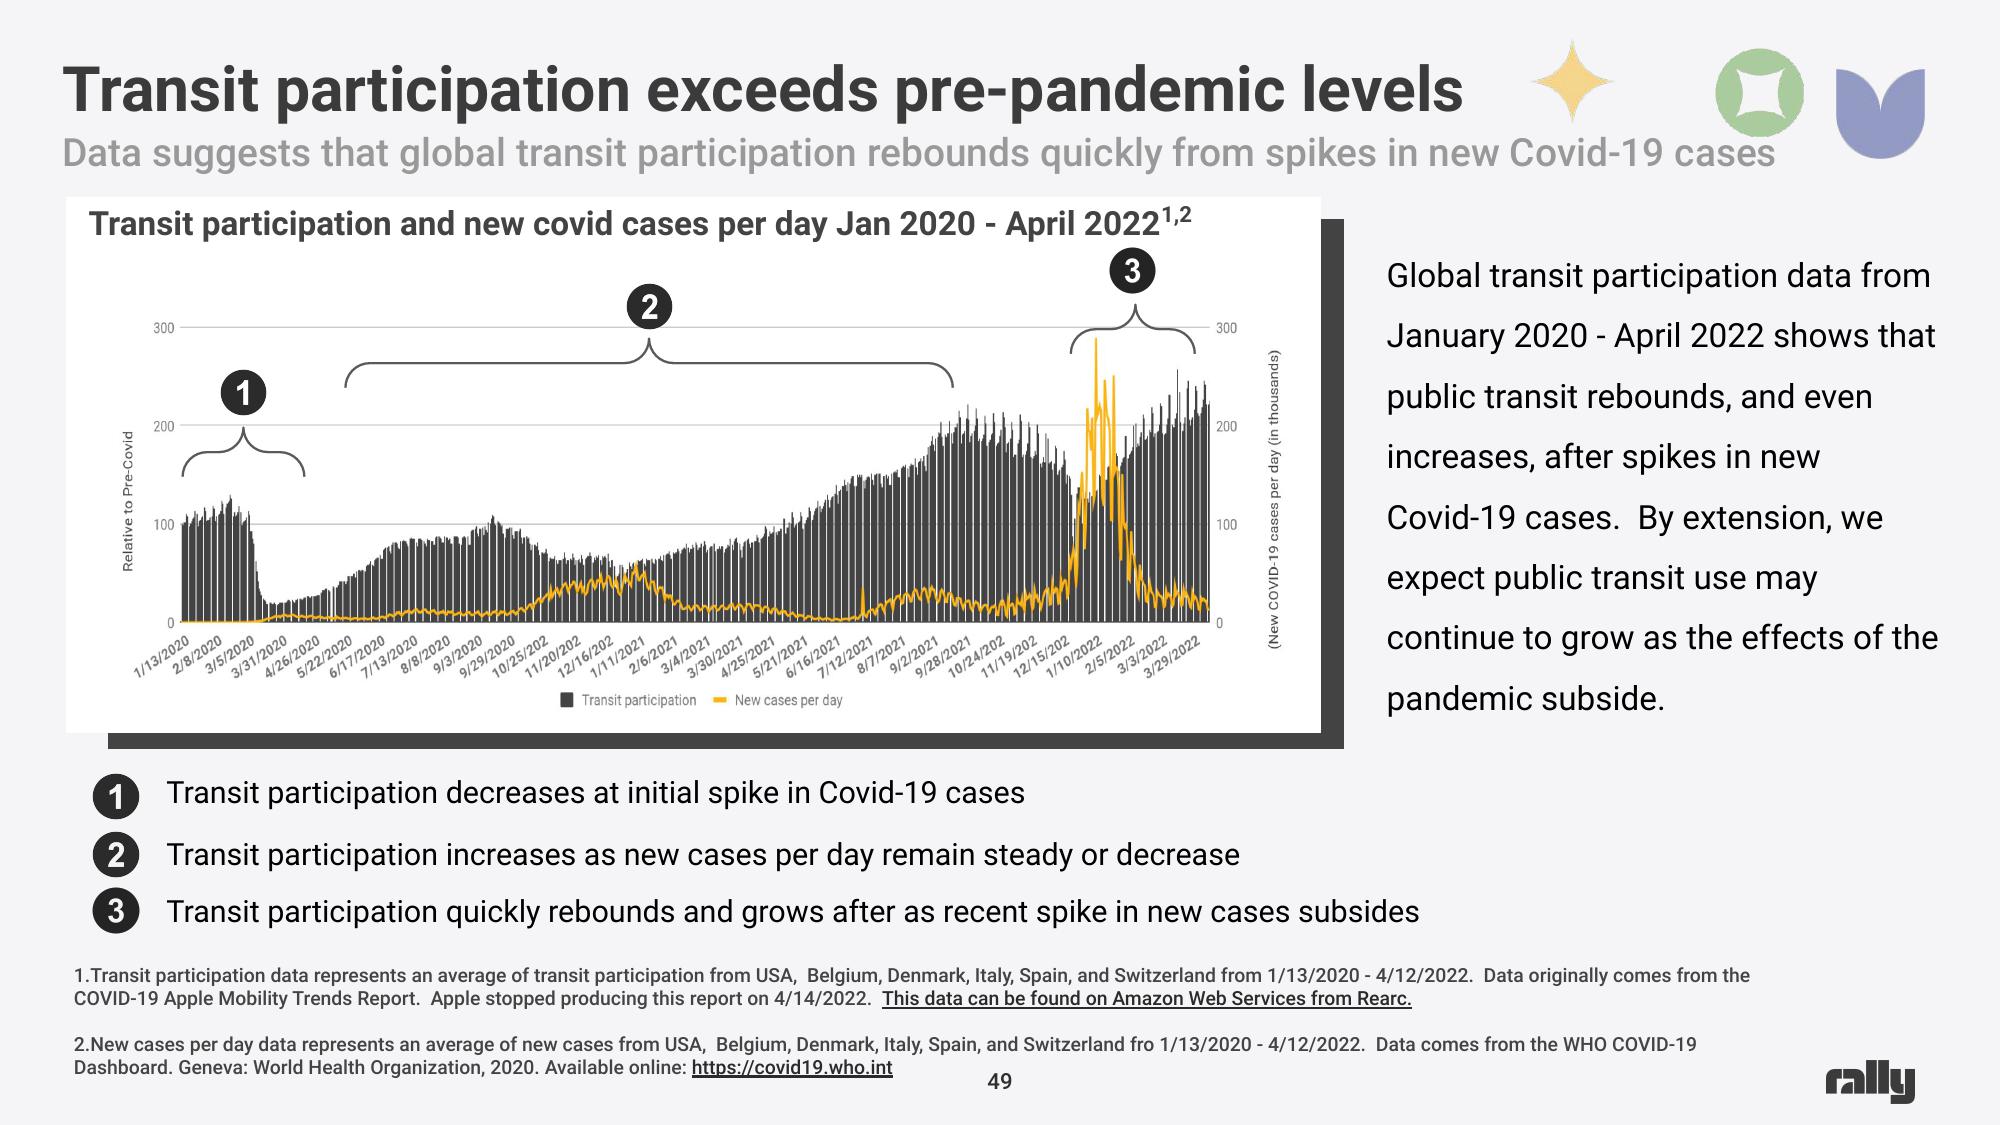
Transit participation and new covid cases per day Jan 2020 - April 2022¹,2
3
Relative to Pre-Covid
1
2
3
300
200
100
1/13/2020
2/8/2020
1
3/5/2020
3/31/2020
4/26/2020
5/22/2020
6/17/2020
7/13/2020
8/8/2020
9/3/2020
9/29/2020
11/20/202
12/16/202
10/25/202
2
1/11/2021
2/6/2021
3/4/2021
3/30/2021
4/25/2021
6/16/2021
5/21/2021
7/12/2021
8/7/2021
Transit participation New cases per day
9/2/2021
9/28/2021
10/24/202
11/19/202
12/15/202
1/10/2022
2/5/2022
3/3/2022
3/29/2022
300
200
100
0
(New COVID-19 cases per day (in thousands)
Global transit participation data from
January 2020 - April 2022 shows that
public transit rebounds, and even
increases, after spikes in new
Covid-19 cases. By extension, we
expect public transit use may
continue to grow as the effects of the
pandemic subside.
Transit participation decreases at initial spike in Covid-19 cases
Transit participation increases as new cases per day remain steady or decrease
Transit participation quickly rebounds and grows after as recent spike in new cases subsides
1. Transit participation data represents an average of transit participation from USA, Belgium, Denmark, Italy, Spain, and Switzerland from 1/13/2020 - 4/12/2022. Data originally comes from the
COVID-19 Apple Mobility Trends Report. Apple stopped producing this report on 4/14/2022. This data can be found on Amazon Web Services from Rearc.
2.New cases per day data represents an average of new cases from USA, Belgium, Denmark, Italy, Spain, and Switzerland fro 1/13/2020 - 4/12/2022. Data comes from the WHO COVID-19
Dashboard. Geneva: World Health Organization, 2020. Available online: https://covid19.who.int
49
rallyView entire presentation