Maersk Results Presentation Deck
A.P. Moller Maersk Group
- Interim Report 02 2015
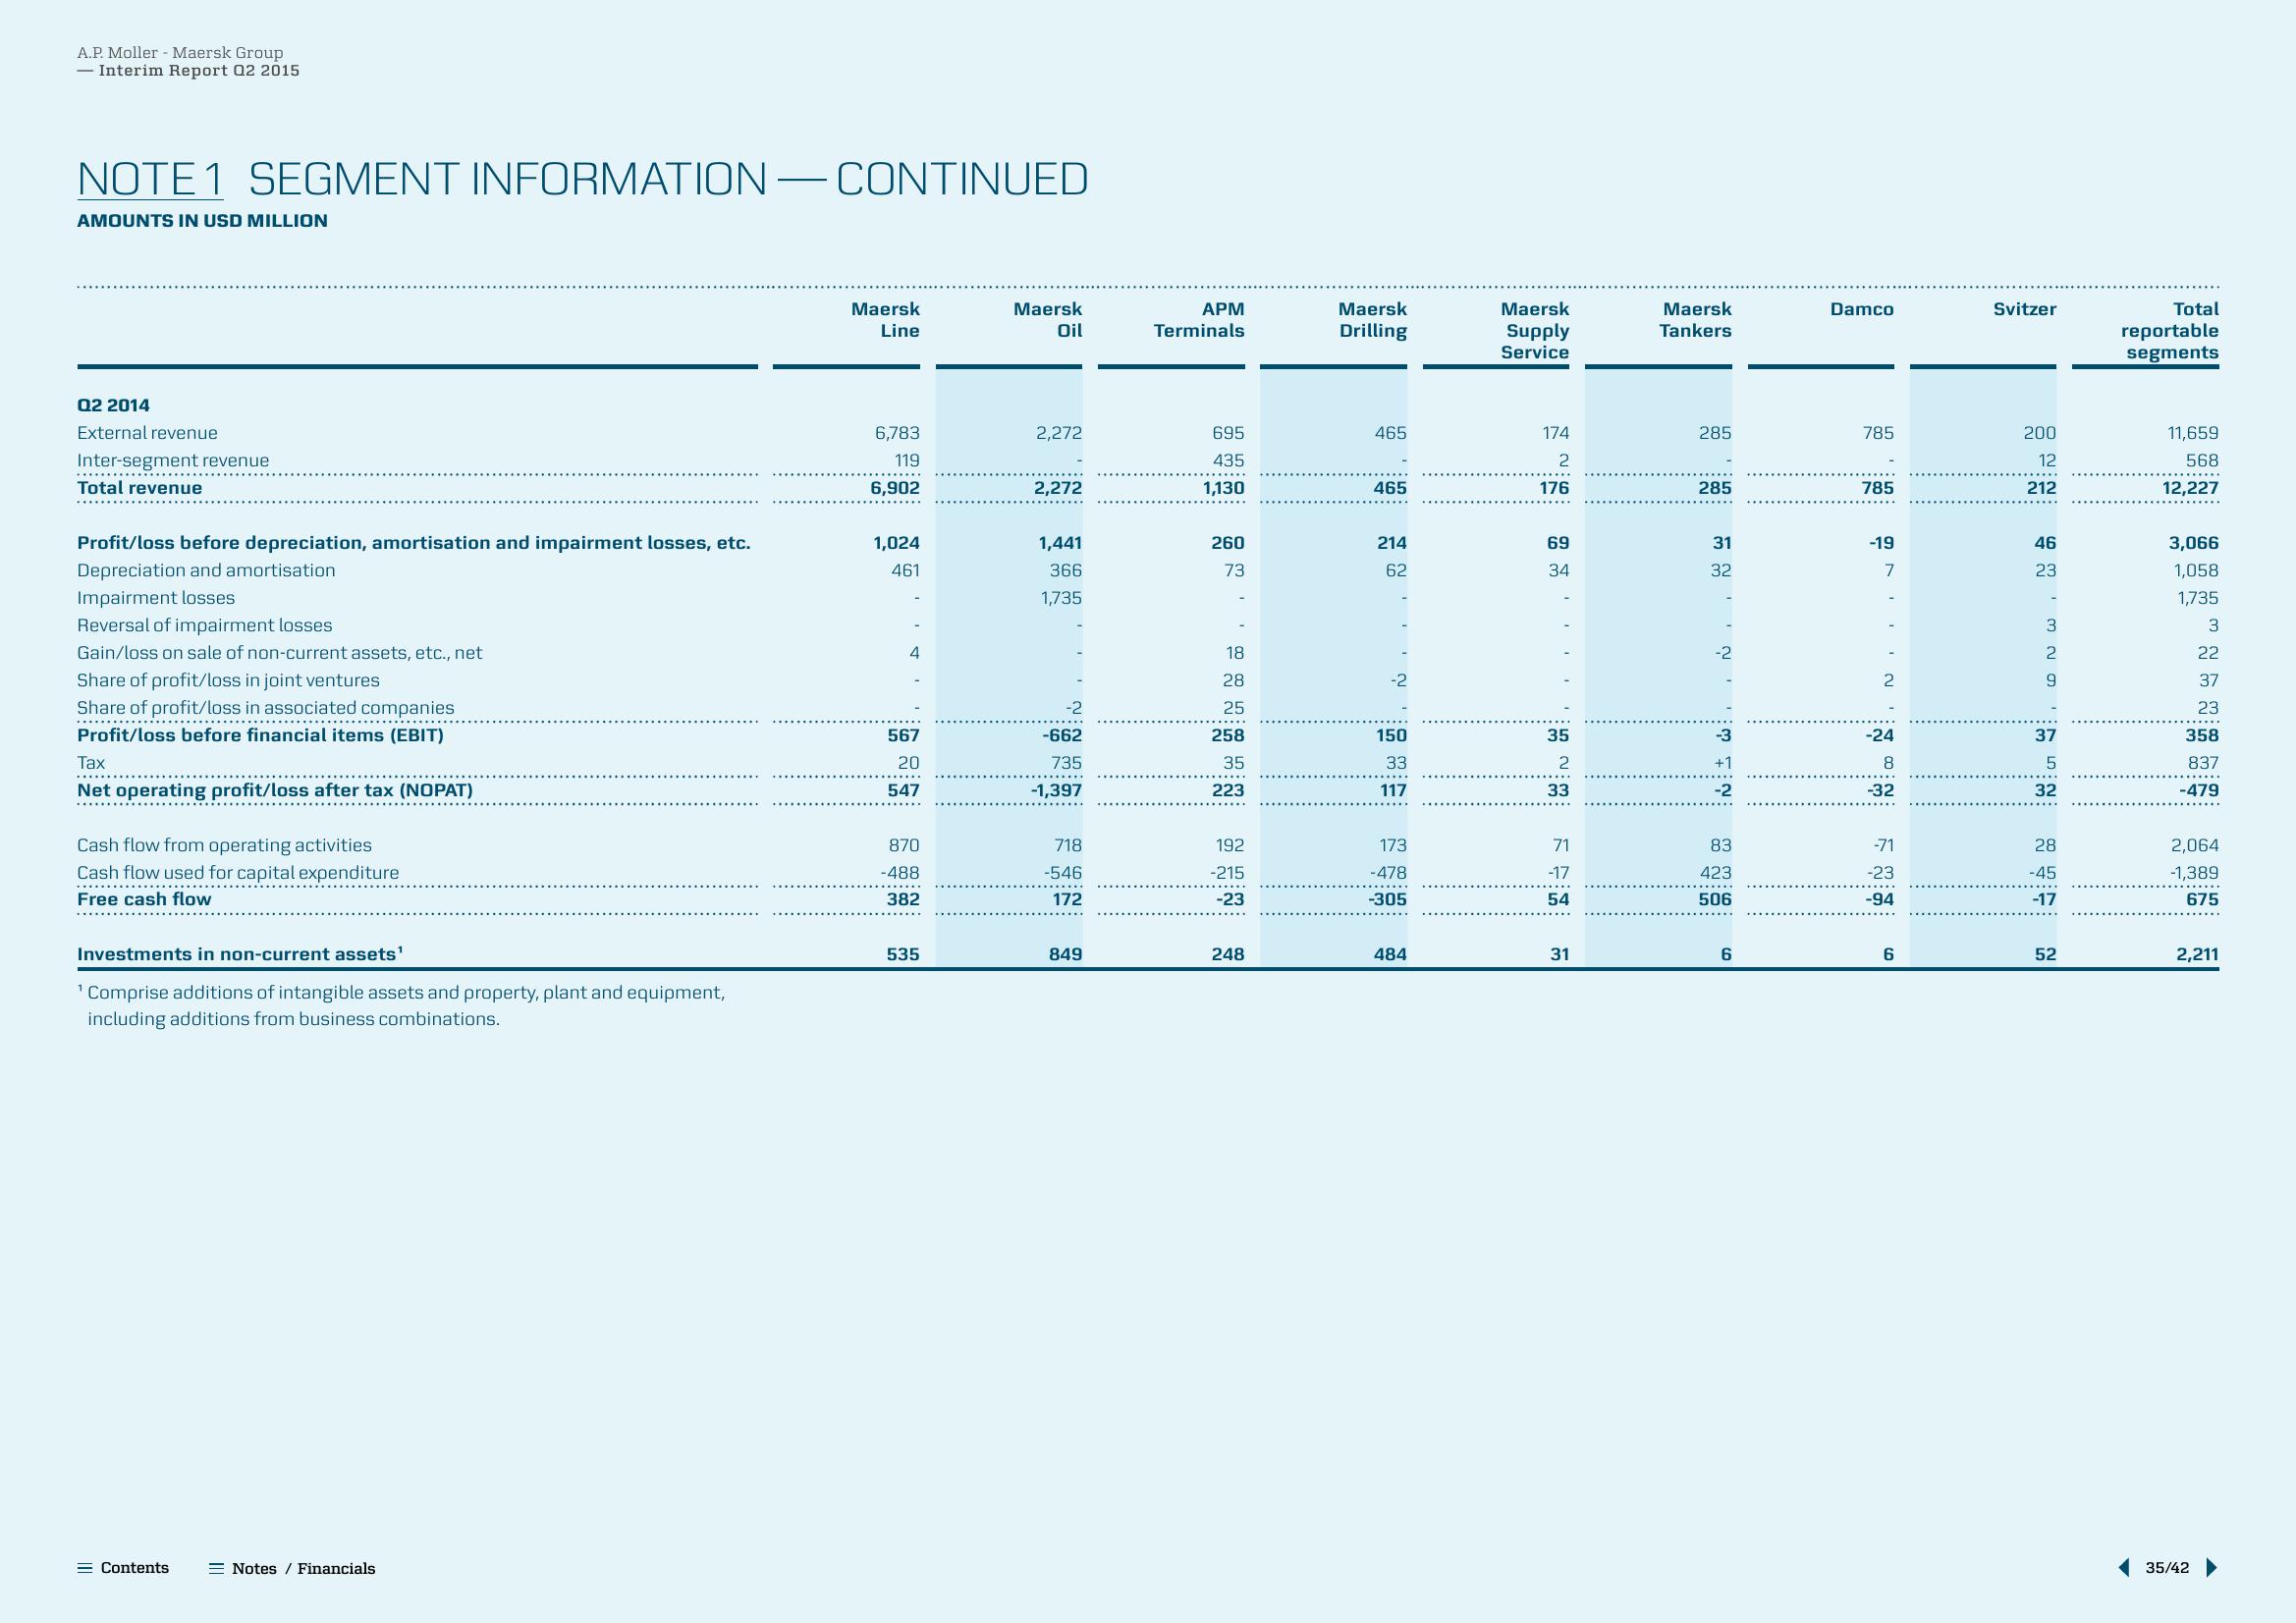
NOTE 1 SEGMENT INFORMATION - CONTINUED
AMOUNTS IN USD MILLION
Q2 2014
External revenue
Inter-segment revenue
Total revenue
Profit/loss before depreciation, amortisation and impairment losses, etc.
Depreciation and amortisation
Impairment losses
Reversal of impairment losses
Gain/loss on sale of non-current assets, etc., net
Share of profit/loss in joint ventures
Share of profit/loss in associated companies
Profit/loss before financial items (EBIT)
..……..…….....
Tax
Net operating profit/loss after tax (NOPAT)
Cash flow from operating activities
Cash flow used for capital expenditure
Free cash flow
Investments in non-current assets¹
¹ Comprise additions of intangible assets and property, plant and equipment,
including additions from business combinations.
= Contents
Notes / Financials
Maersk
Line
6,783
119
6,902
1,024
461
4
567
20
547
870
-488
382
535
Maersk
Oil
2,272
2,272
1,441
366
1,735
-2
-662
735
-1,397
718
-546
172
849
APM
Terminals
695
435
1,130
260
73
18
28
25
258
35
223
192
-215
-23
248
Maersk
Drilling
465
465
214
62
-2
150
33
117
173
-478
-305
484
Maersk
Supply
Service
174
2
176
69
34
35
2
33
71
-17
54
31
Maersk
Tankers
285
285
31
32
-2
-3
+1
-2
83
423
506
6
Damco
785
785
-19
7
2
-24
8
-32
-71
-23
-94
6
Svitzer
200
12
212
46
23
-
329
37
5
32
28
-45
-17
52
Total
reportable
segments
11,659
568
12,227
3,066
1,058
1,735
3
22
37
23
358
837
-479
2,064
-1,389
675
2,211
35/42View entire presentation