Main Street Capital Investor Day Presentation Deck
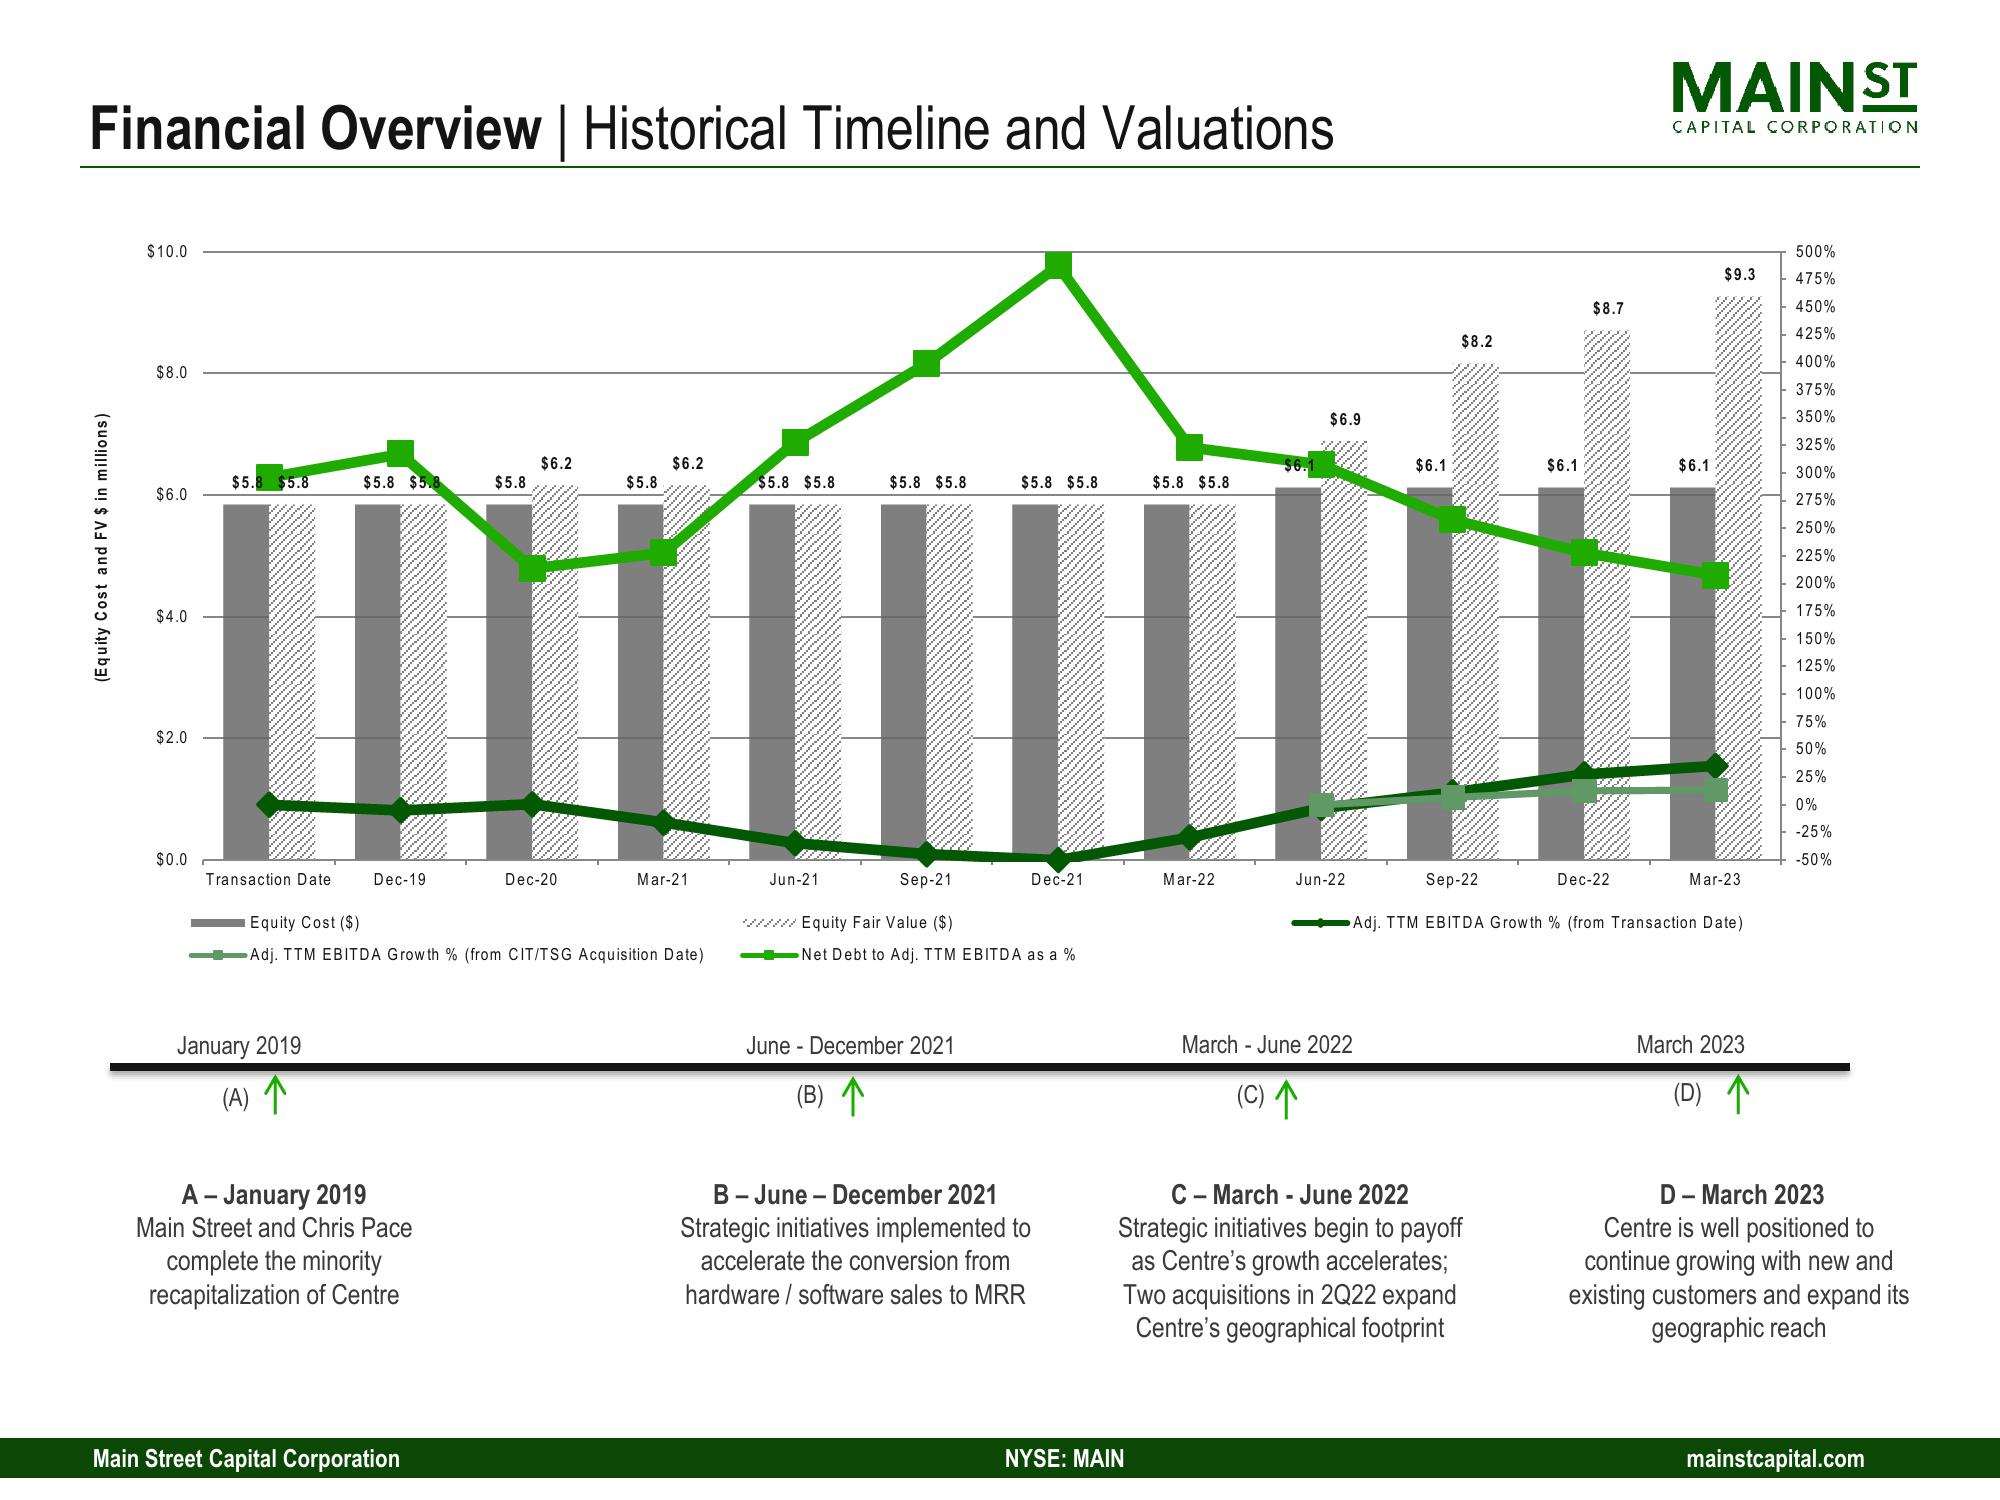
Financial Overview | Historical Timeline and Valuations
(Equity Cost and FV $ in millions)
$10.0
$8.0
$6.0
$4.0
$2.0
$0.0
$5.8 $5.8
Transaction Date
$5.8 $5.8
January 2019
(A) 个
Dec-19
A - January 2019
Main Street and Chris Pace
complete the minority
recapitalization of Centre
$5.8
Main Street Capital Corporation
$6.2
Dec-20
Equity Cost ($)
Adj. TTM EBITDA Growth % (from CIT/TSG Acquisition Date)
$5.8
$6.2
Mar-21
$5.8 $5.8
$5.8 $5.8
Jun-21
Sep-21
wwww.Equity Fair Value ($)
$5.8 $5.8
June - December 2021
(B) 个
Dec-21
Net Debt to Adj. TTM EBITDA as a %
B-June - December 2021
Strategic initiatives implemented to
accelerate the conversion from
hardware/software sales to MRR
$5.8 $5.8
NYSE: MAIN
Mar-22
$6.9
Jun-22
March June 2022
(C) 个
$6.1
$8.2
C March - June 2022
Strategic initiatives begin to payoff
as Centre's growth accelerates;
Two acquisitions in 2Q22 expand
Centre's geographical footprint
$6.1
$8.7
DOOG
MAIN ST
Dec-22
CAPITAL CORPORATION
$6.1
Sep-22
Adj. TTM EBITDA Growth % (from Transaction Date)
$9.3
Mar-23
March 2023
(D) 个
500%
475%
450%
425%
400%
375%
350%
325%
300%
275%
250%
225%
200%
175%
150%
125%
100%
75%
50%
25%
0%
-25%
-50%
D - March 2023
Centre is well positioned to
continue growing with new and
existing customers and expand its
geographic reach
mainstcapital.comView entire presentation