Ford Investor Conference Presentation Deck
U.S. Origination
Metrics And
Credit Loss
Drivers
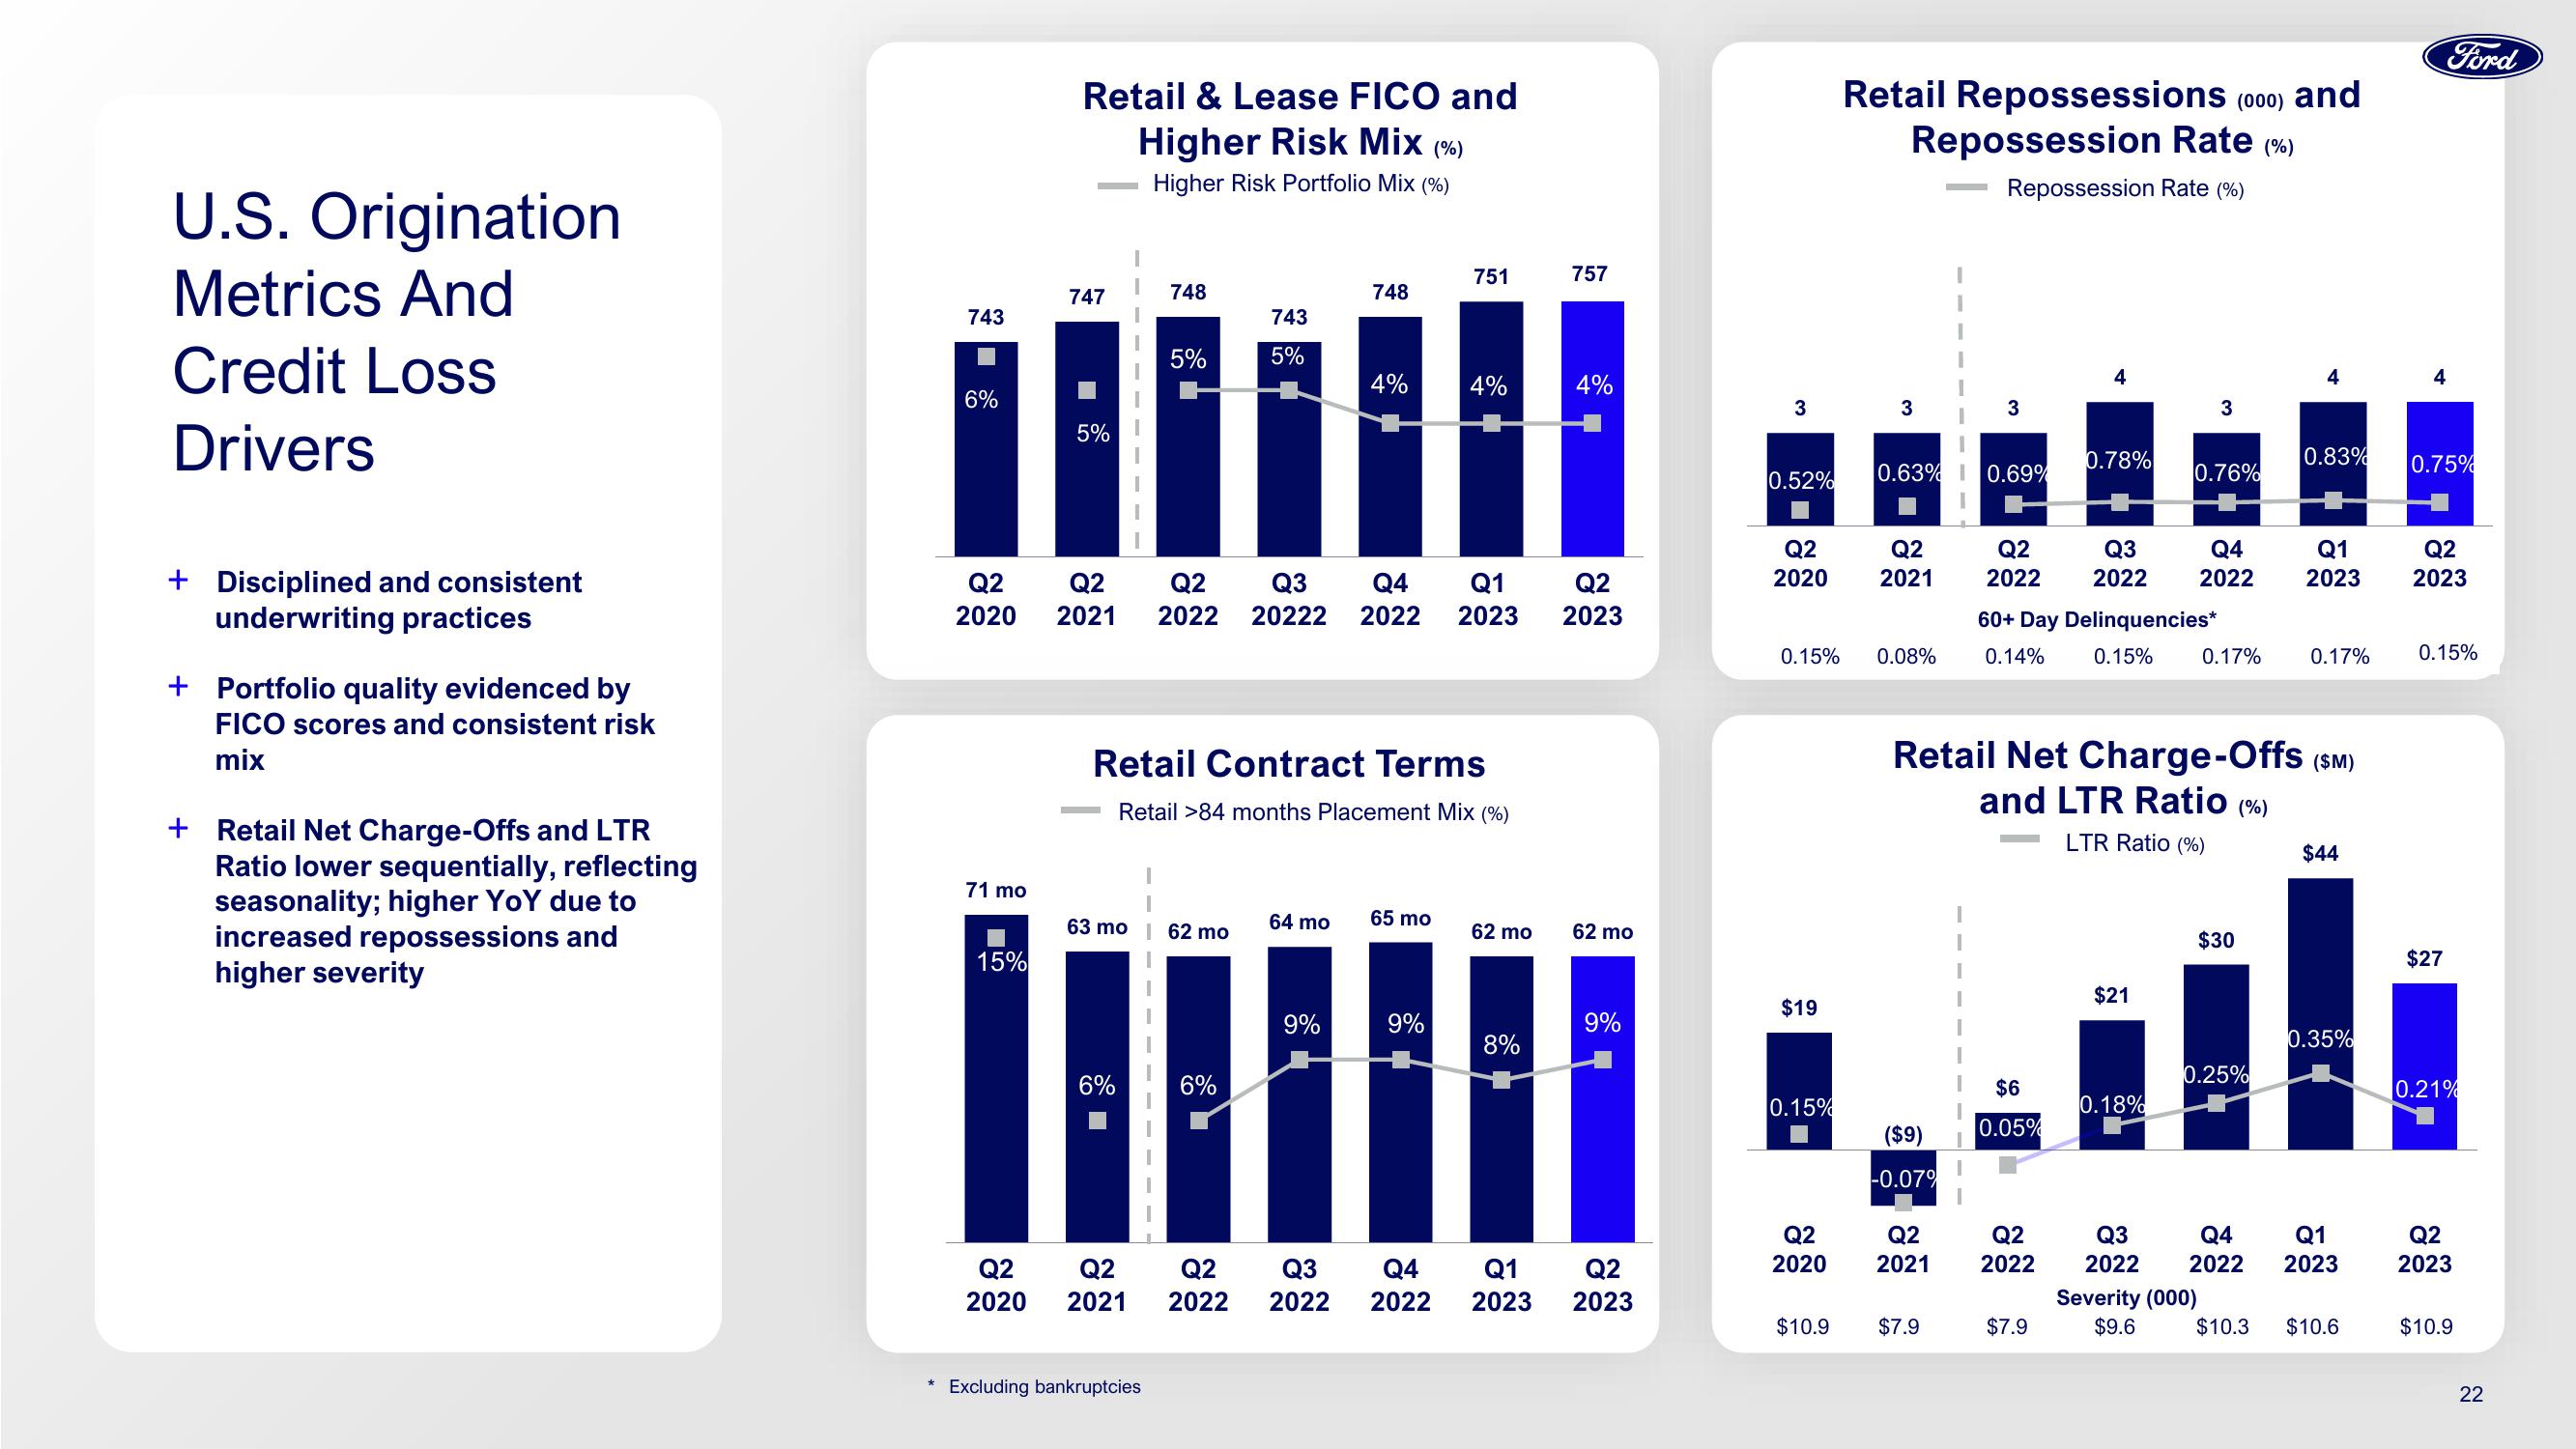
+ Disciplined and consistent
underwriting practices
+ Portfolio quality evidenced by
FICO scores and consistent risk
mix
+ Retail Net Charge-Offs and LTR
Ratio lower sequentially, reflecting
seasonality; higher YoY due to
increased repossessions and
higher severity
*
743
6%
Q2
2020
71 mo
15%
Retail & Lease FICO and
Higher Risk Mix (%)
Higher Risk Portfolio Mix (%)
747
5%
748
6%
5%
63 mo | 62 mo
Q2
Q2
2020 2021
Excluding bankruptcies
743
5%
Retail Contract Terms
Retail >84 months Placement Mix (%)
6%
Q2
Q2 Q2 Q3 Q4 Q1
2021 2022 20222 2022 2023 2023
Q2
2022
64 mo
748
9%
4%
Q3
2022
751
65 mo
4%
9%
62 mo
8%
757
Q4 Q1
2022
4%
62 mo
9%
Q2
2023 2023
3 3
0.52%
Q2
2020
$19
0.15%
Retail Repossessions (000) and
Repossession Rate (%)
Repossession Rate (%)
0.15% 0.08%
Q2
2020
$10.9
Q2
2021
0.63% 0.69%
I
($9)
-0.07%
3
$7.9
$6
0.05%
Q2
Q2
2021 2022
4
0.78%
Q2 Q3 Q4
2022 2022 2022
60+ Day Delinquencies*
0.14% 0.15%
$7.9
3
$21
0.76%
Retail Net Charge-Offs (SM)
and LTR Ratio (%)
LTR Ratio (%)
0.18%
0.17%
$30
4
0.25%
0.83%
Q1
2023
0.17%
$44
0.35%
Q3 Q4 Q1
2022 2022 2023
Severity (000)
$9.6
$10.3 $10.6
4
Ford
0.75%
Q2
2023
0.15%
$27
0.21%
Q2
2023
$10.9
22View entire presentation