Dave Results Presentation Deck
Improving delinquency
performance
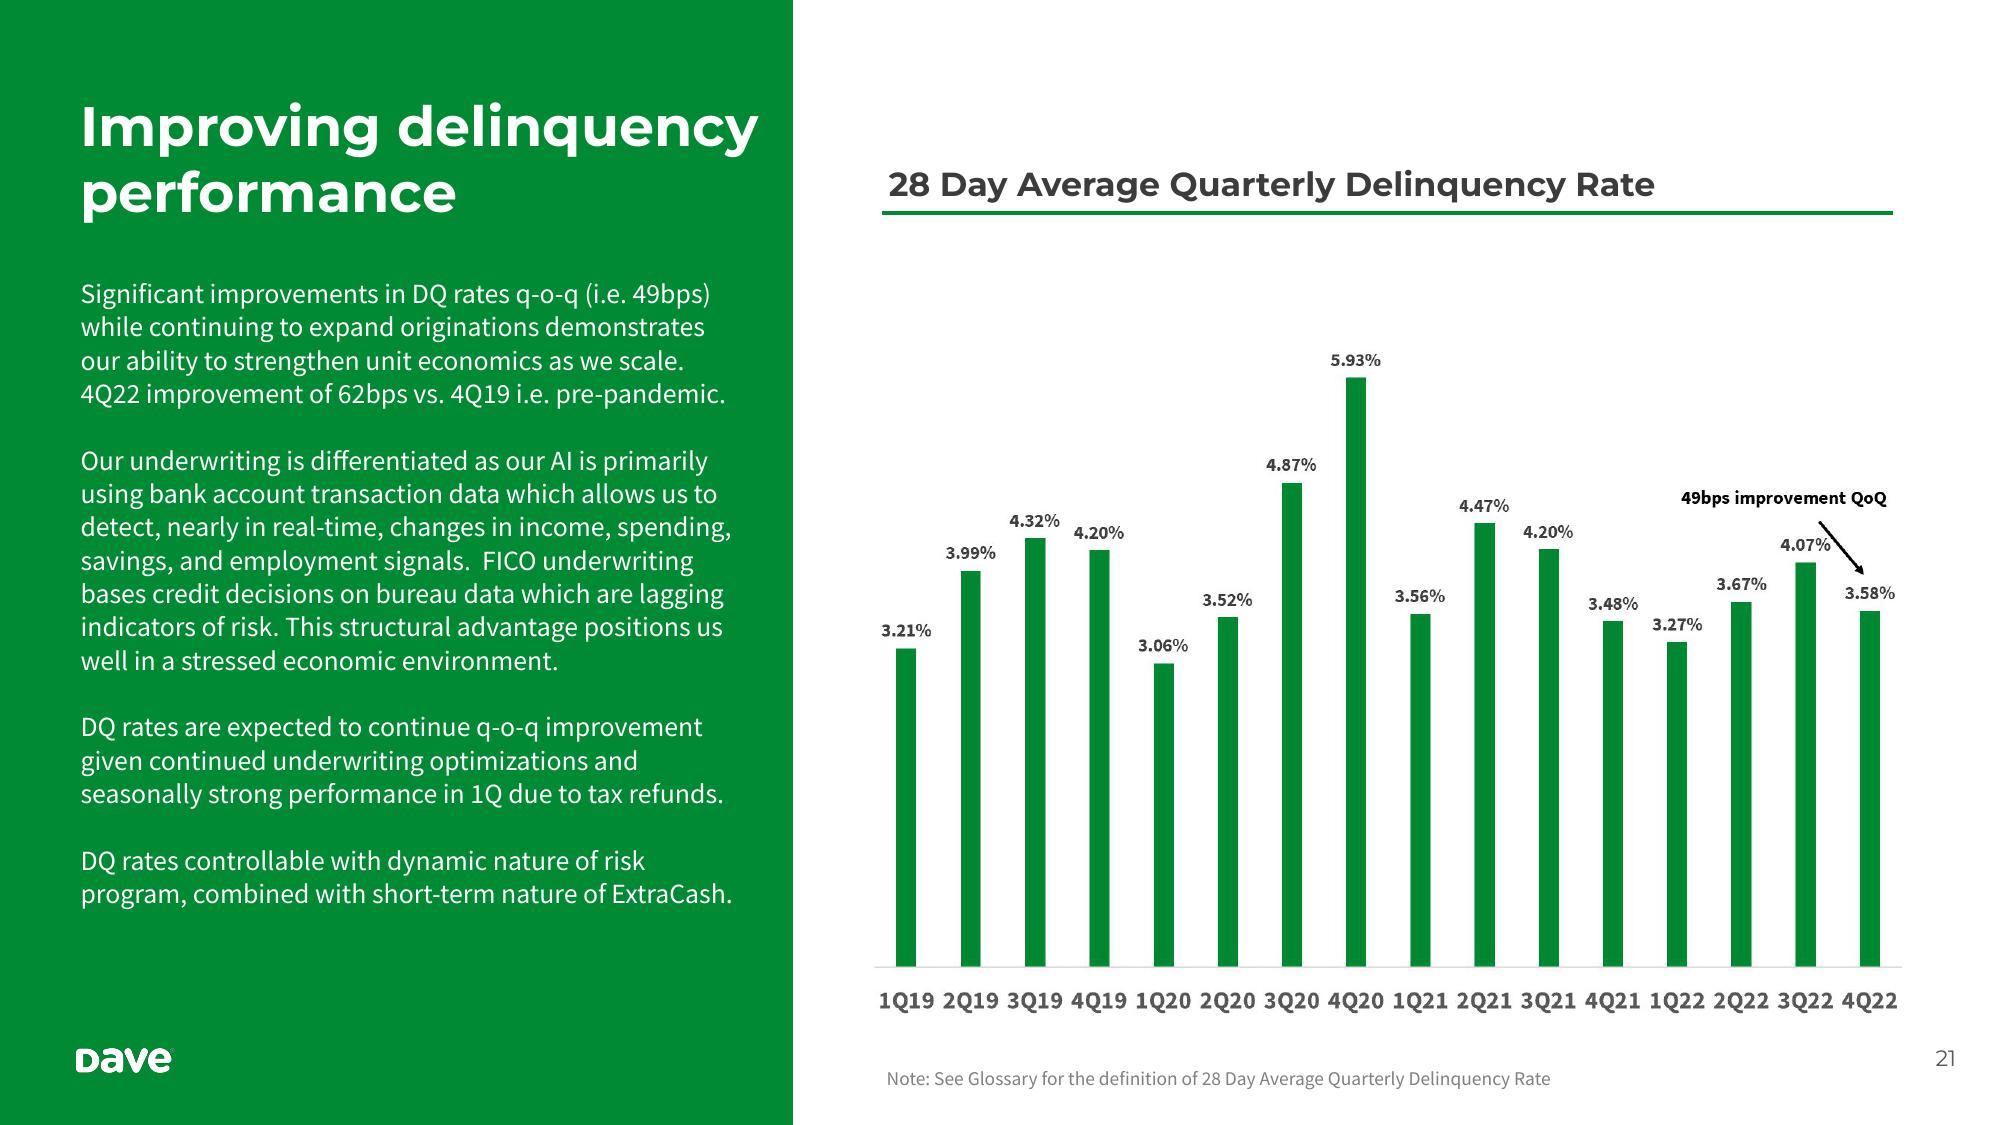
Significant improvements in DQ rates q-o-q (i.e. 49bps)
while continuing to expand originations demonstrates
our ability to strengthen unit economics as we scale.
4Q22 improvement of 62bps vs. 4Q19 i.e. pre-pandemic.
Our underwriting is differentiated as our Al is primarily
using bank account transaction data which allows us to
detect, nearly in real-time, changes in income, spending,
savings, and employment signals. FICO underwriting
bases credit decisions on bureau data which are lagging
indicators of risk. This structural advantage positions us
well in a stressed economic environment.
DQ rates are expected to continue q-o-q improvement
given continued underwriting optimizations and
seasonally strong performance in 1Q due to tax refunds.
DQ rates controllable with dynamic nature of risk
program, combined with short-term nature of ExtraCash.
Dave
28 Day Average Quarterly Delinquency Rate
3.21%
3.99%
4.32%
4.20%
3.06%
3.52%
4.87%
5.93%
3.56%
4.47%
4.20%
3.48%
Note: See Glossary for the definition of 28 Day Average Quarterly Delinquency Rate
49bps improvement QoQ
3.27%
3.67%
4.07%
3.58%
||| ||||||||
1Q19 2019 3Q19 4Q19 1020 2020 3Q20 4Q20 1Q21 2Q21 3Q21 4Q21 1Q22 2022 3Q22 4Q22
21View entire presentation