Netstreit Investor Presentation Deck
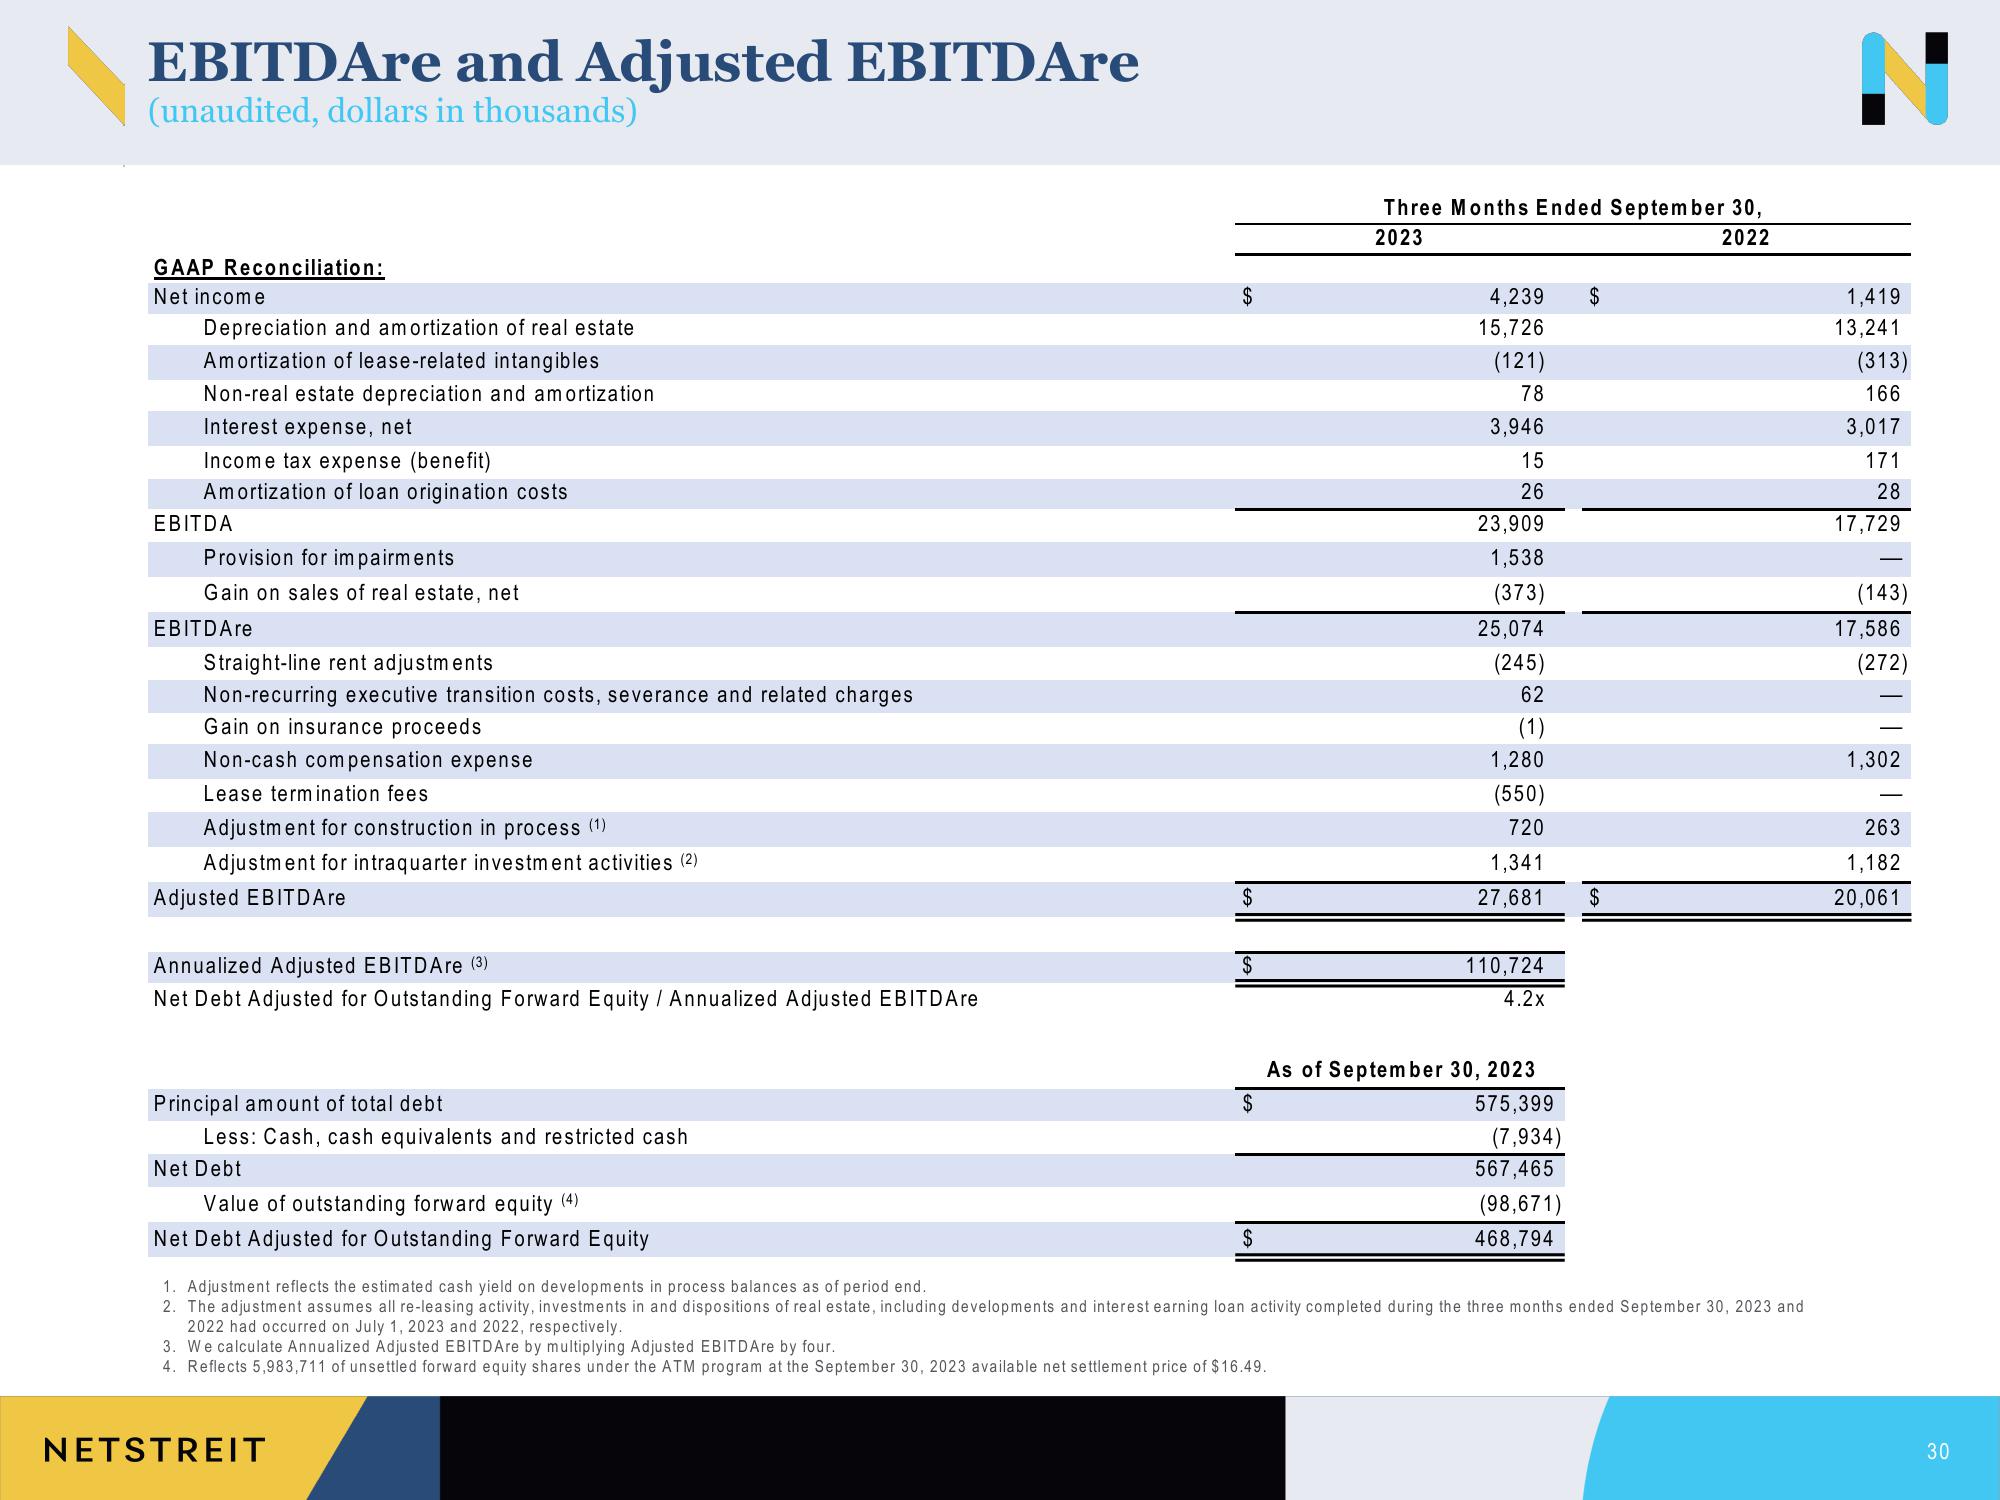
EBITDAre and Adjusted EBITDAre
(unaudited, dollars in thousands)
GAAP Reconciliation:
Net income
Depreciation and amortization of real estate
Amortization of lease-related intangibles
Non-real estate depreciation and amortization
Interest expense, net
Income tax expense (benefit)
Amortization of loan origination costs
EBITDA
Provision for impairments
Gain on sales of real estate, net
EBITDAre
Straight-line rent adjustments
Non-recurring executive transition costs, severance and related charges
Gain on insurance proceeds
Non-cash compensation expense
Lease termination fees
Adjustment for construction in process (¹)
Adjustment for intraquarter investment activities (2)
Adjusted EBITD Are
Annualized Adjusted EBITDAre (3)
Net Debt Adjusted for Outstanding Forward Equity / Annualized Adjusted EBITDAre
Principal amount of total debt
Less: Cash, cash equivalents and restricted cash
Net Debt
Value of outstanding forward equity (4)
Net Debt Adjusted for Outstanding Forward Equity
$
$
NETSTREIT
$
$
Three Months Ended September 30,
2023
2022
3. We calculate Annualized Adjusted EBITDAre by multiplying Adjusted EBITDAre by four.
4. Reflects 5,983,711 of unsettled forward equity shares under the ATM program at the September 30, 2023 available net settlement price of $16.49.
4,239 $
15,726
(121)
78
3,946
15
26
23,909
1,538
(373)
25,074
(245)
62
(1)
1,280
(550)
720
1,341
27,681
As of September 30, 2023
$
575,399
110,724
4.2x
(7,934)
567,465
(98,671)
468,794
1. Adjustment refle
cash yield on developments process balances as of period end.
2. The adjustment assumes all re-leasing activity, investments in and dispositions of real estate, including developments and interest earning loan activity completed during the three months ended September 30, 2023 and
2022 had occurred on July 1, 2023 and 2022, respectively.
$
1,419
13,241
(313)
166
3,017
171
28
17,729
(143)
17,586
(272)
1,302
263
1,182
20,061
30View entire presentation