Active and Passive Investing
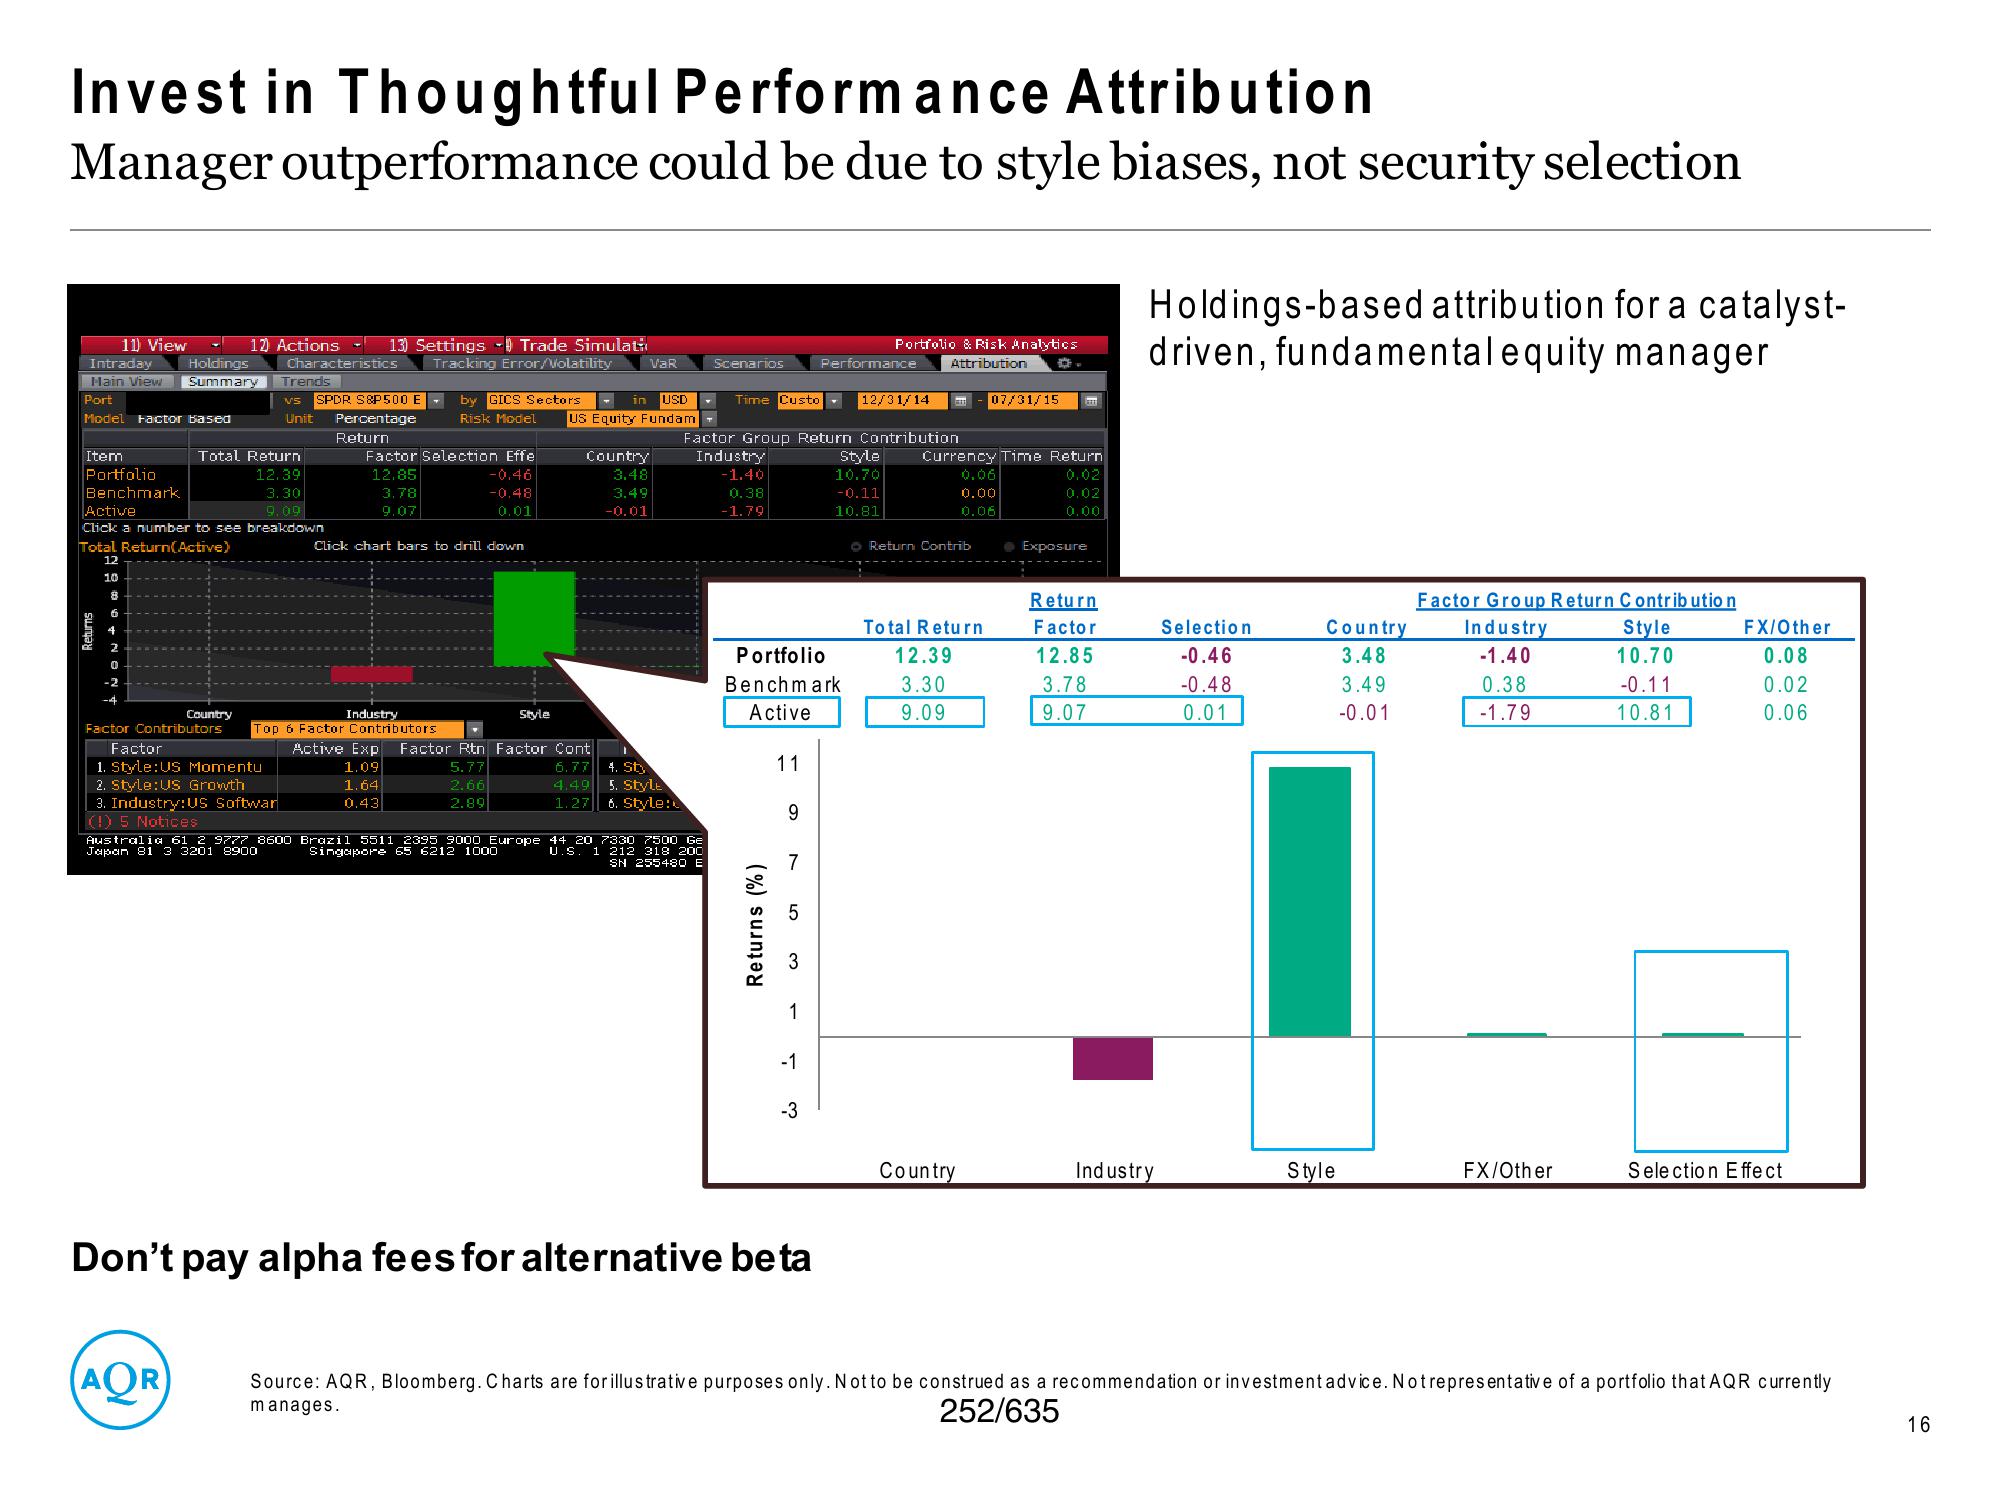
Invest in Thoughtful Performance Attribution
Manager outperformance could be due to style biases, not security selection
11) View
Intraday
Main View
Port
Model Factor based
Item
Portfolio
Benchmark
8
4
Holdings
Summary
Total Return
12.39
3.30
Active
9.09
Click a number to see breakdown
Total Return(Active)
12
10
12) Actions - 13) Settings - Trade Simulati
Characteristics Tracking Error/Volatility
Country
Factor Contributors
Factor
1. Style: US Momentu
2. Style: US Growth
(AOR
Trends
VS
Unit
3. Industry: US Softwar
(1) 5 Notices
SPDR S&P500
Percentage
Return
Factor Selection Effe
12.85
Industry
Top 6 Factor Contributors
Active Exp
1.09
3.78
9.07
1.64
0.43
by GICS Sectors
in USD
Risk Model US Equity Fundam
Click chart bars to drill down
-0.46
-0.48
0.01
Style
VaR
Australia 61 2 9777 8600 Brazil 5511 2395 9000 Europe
Japan 81 3 3201 8900
Singapore 65 6212 1000
Country
3.48
3.49
-0.01
Factor Rtn Factor Cont
5.77
6.77
4. Sty
4.49 5. Style
2.66
2.89
1.27 6. Style:
Scenarios
44 20 7330 7500 Ge
U.S. 1 212 318 200
SN 255480 E
Time Custo
Factor Group Return Contribution
Industry
-1.40
0.38
-1.79
Returns (%)
11
Portfolio
Benchmark
Active
9
7
1
-1
-3
Don't pay alpha fees for alternative beta
Performance
Portfolio & Risk Analytics
Attribution
12/31/14
Style
10.70
-0.11
10.81
Currency Time Return
0.02
0.02
0.00
Return Contrib
07/31/15
0.00
0.06
Total Return
12.39
3.30
9.09
Country
● Exposure
Return
Factor
12.85
3.78
9.07
Holdings-based attribution for a catalyst-
driven, fundamental equity manager
Industry
Selection
-0.46
-0.48
0.01
Country Industry
3.48
-1.40
Style
Factor Group Return Contribution
3.49
-0.01
0.38
-1.79
FX/Other
Style
10.70
-0.11
10.81
FX/Other
0.08
0.02
0.06
Selection Effect
Source: AQR, Bloomberg. Charts are for illustrative purposes only. Not to be construed as a recommendation or investment advice. Notre presentative of a portfolio that AQR currently
manages.
252/635
16View entire presentation