Kinnevik Results Presentation Deck
Intro
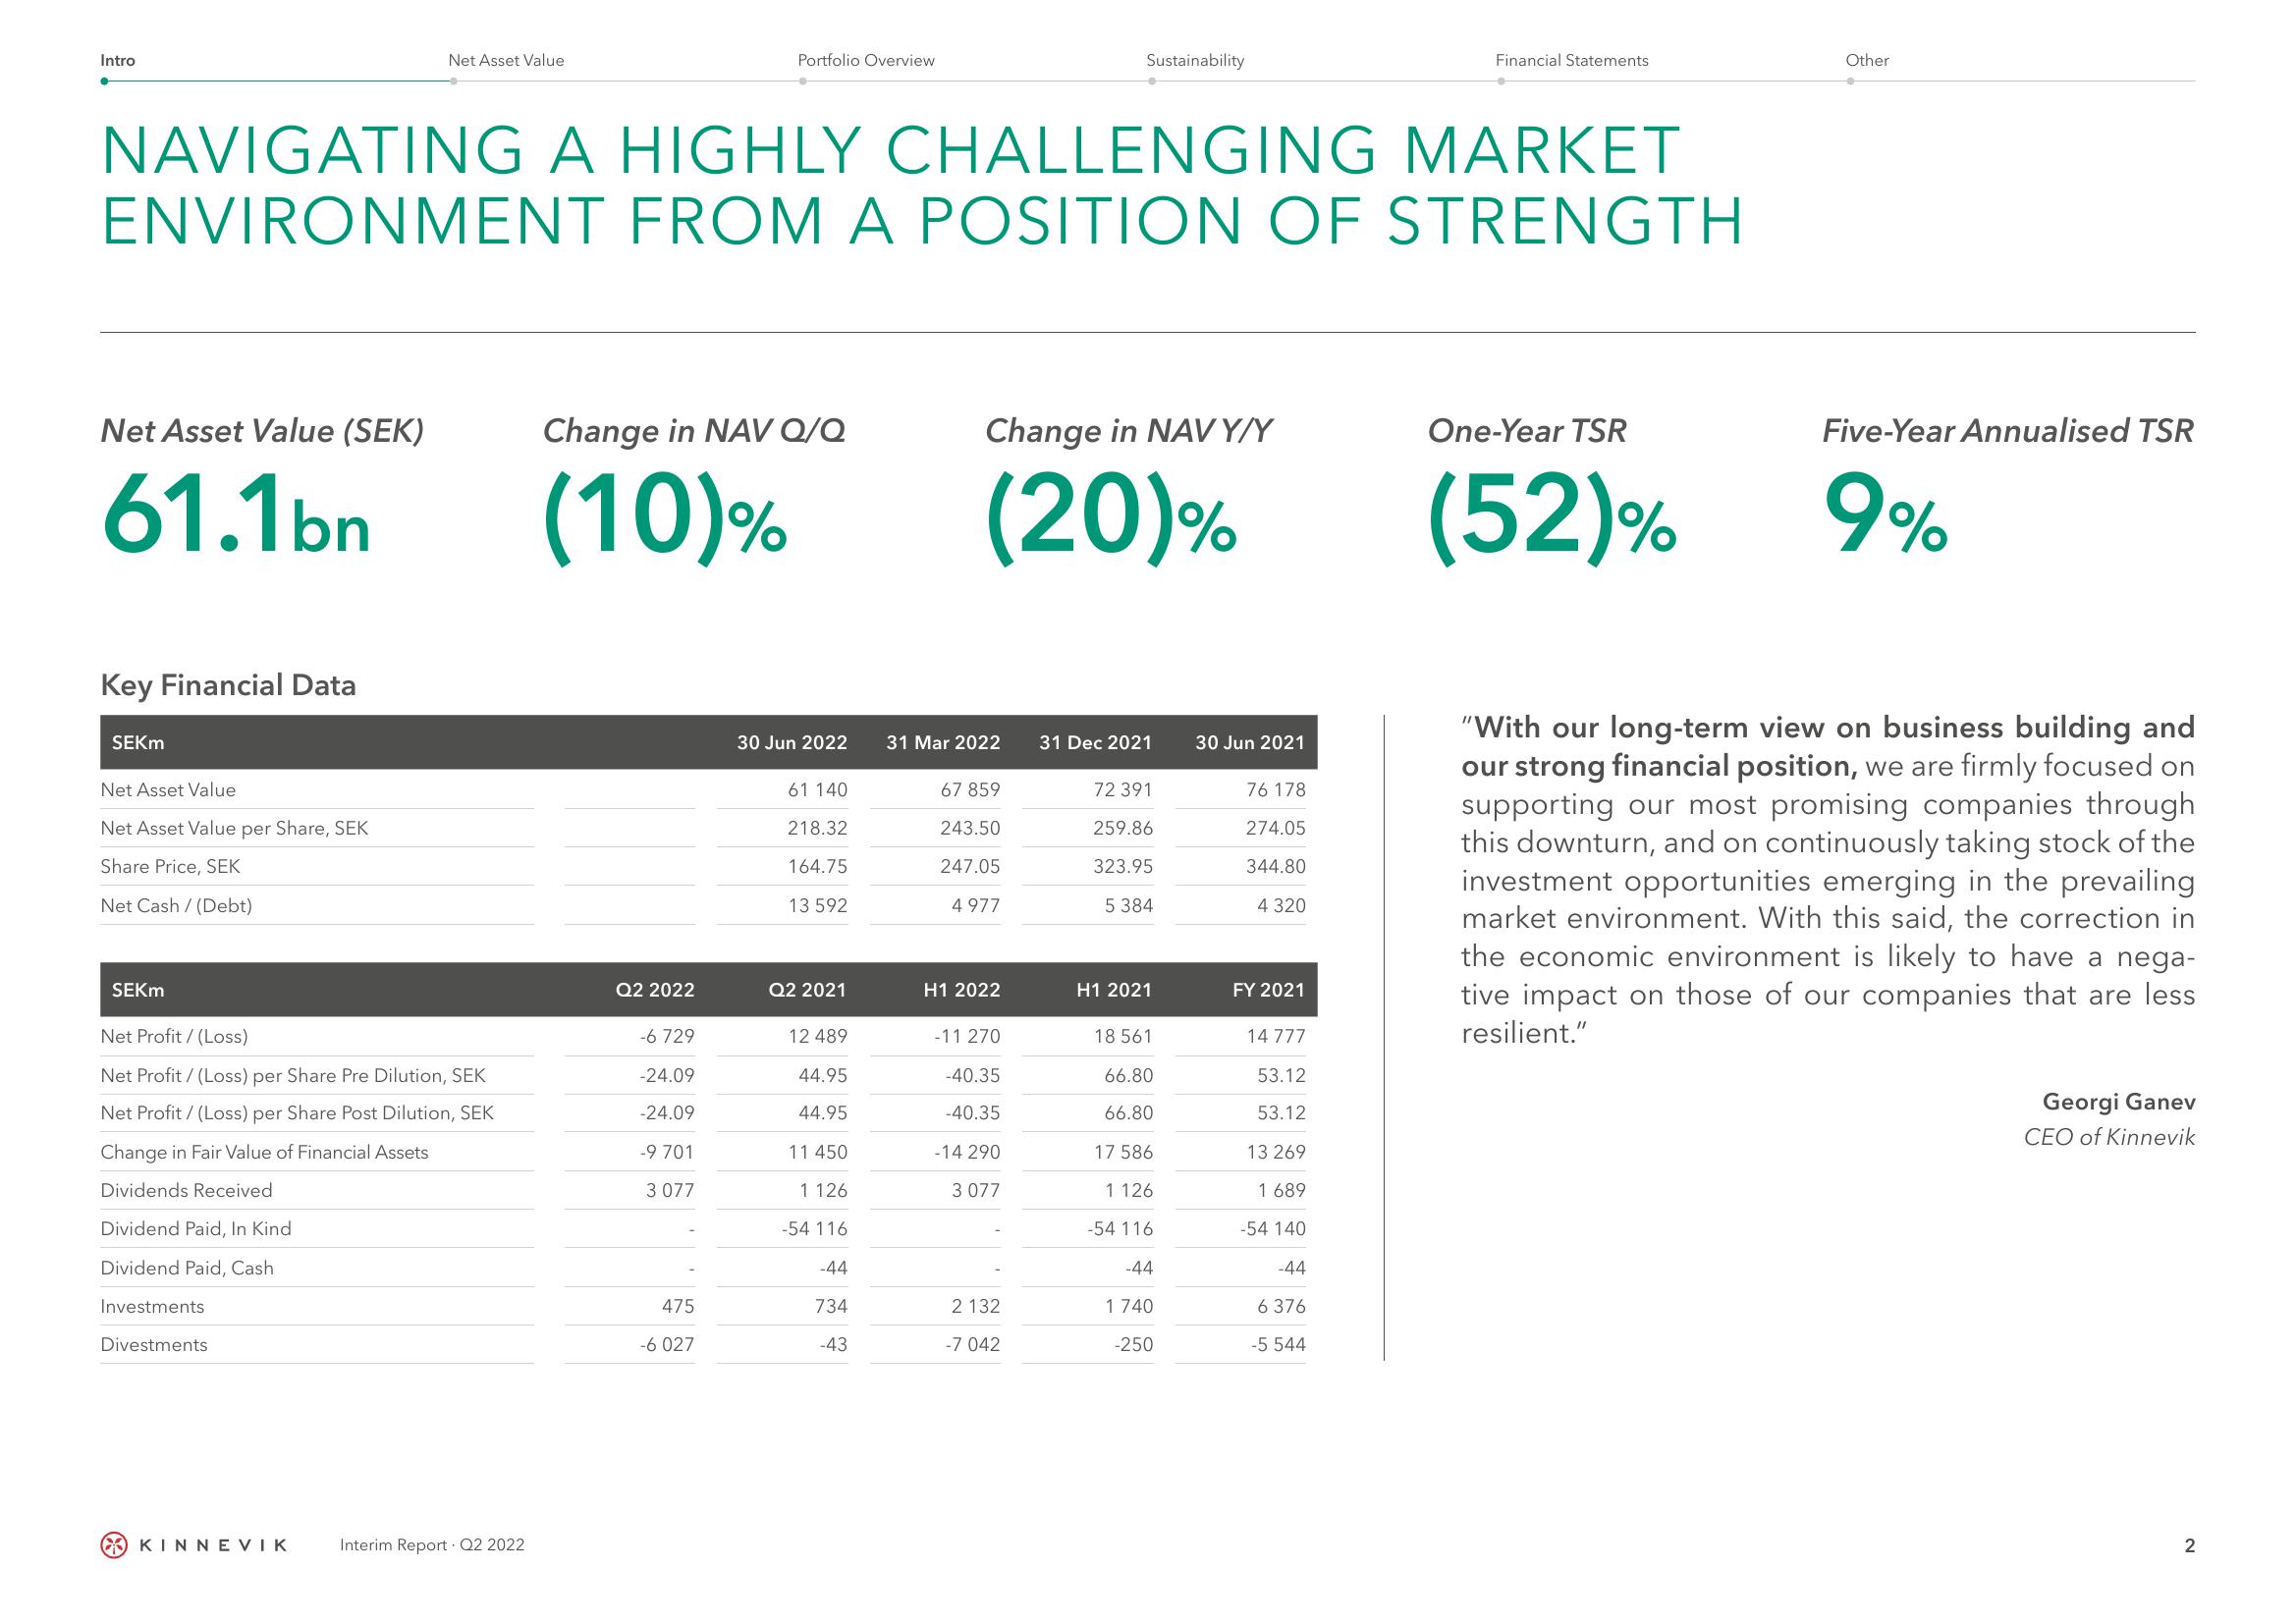
Net Asset Value (SEK)
61.1bn
Key Financial Data
SEKM
NAVIGATING A HIGHLY CHALLENGING MARKET
ENVIRONMENT FROM A POSITION OF STRENGTH
Net Asset Value
Net Asset Value per Share, SEK
Share Price, SEK
Net Cash/ (Debt)
SEKM
Net Asset Value
Net Profit/(Loss)
Net Profit / (Loss) per Share Pre Dilution, SEK
Net Profit / (Loss) per Share Post Dilution, SEK
Change in Fair Value of Financial Assets
Dividends Received
Dividend Paid, In Kind
Dividend Paid, Cash
Investments
Divestments
KINNEVIK
Interim Report. Q2 2022
Change in NAV Q/Q
(10)%
Q2 2022
-6 729
-24.09
-24.09
-9 701
Portfolio Overview
3 077
475
-6 027
61 140
30 Jun 2022 31 Mar 2022 31 Dec 2021
218.32
164.75
13 592
Q2 2021
12 489
44.95
44.95
11 450
1126
-54 116
-44
734
-43
Change in NAVY/Y
(20)%
67 859
243.50
247.05
4 977
H1 2022
Sustainability
-11 270
-40.35
-40.35
-14 290
3 077
2 132
-7 042
72 391
259.86
323.95
5 384
H1 2021
18 561
66.80
66.80
17 586
1 126
-54 116
-44
1 740
-250
30 Jun 2021
76 178
274.05
344.80
4 320
FY 2021
14 777
53.12
53.12
13 269
1 689
-54 140
Financial Statements
-44
6 376
-5 544
One-Year TSR
(52)%
Other
Five-Year Annualised TSR
9%
"With our long-term view on business building and
our strong financial position, we are firmly focused on
supporting our most promising companies through
this downturn, and on continuously taking stock of the
investment opportunities emerging in the prevailing
market environment. With this said, the correction in
the economic environment is likely to have a nega-
tive impact on those of our companies that are less
resilient."
Georgi Ganev
CEO of Kinnevik
2View entire presentation