HHR Investor Presentation Deck
Powerful Network Effect Getting Stronger Each Year as We
Widen the Gap to Competitors
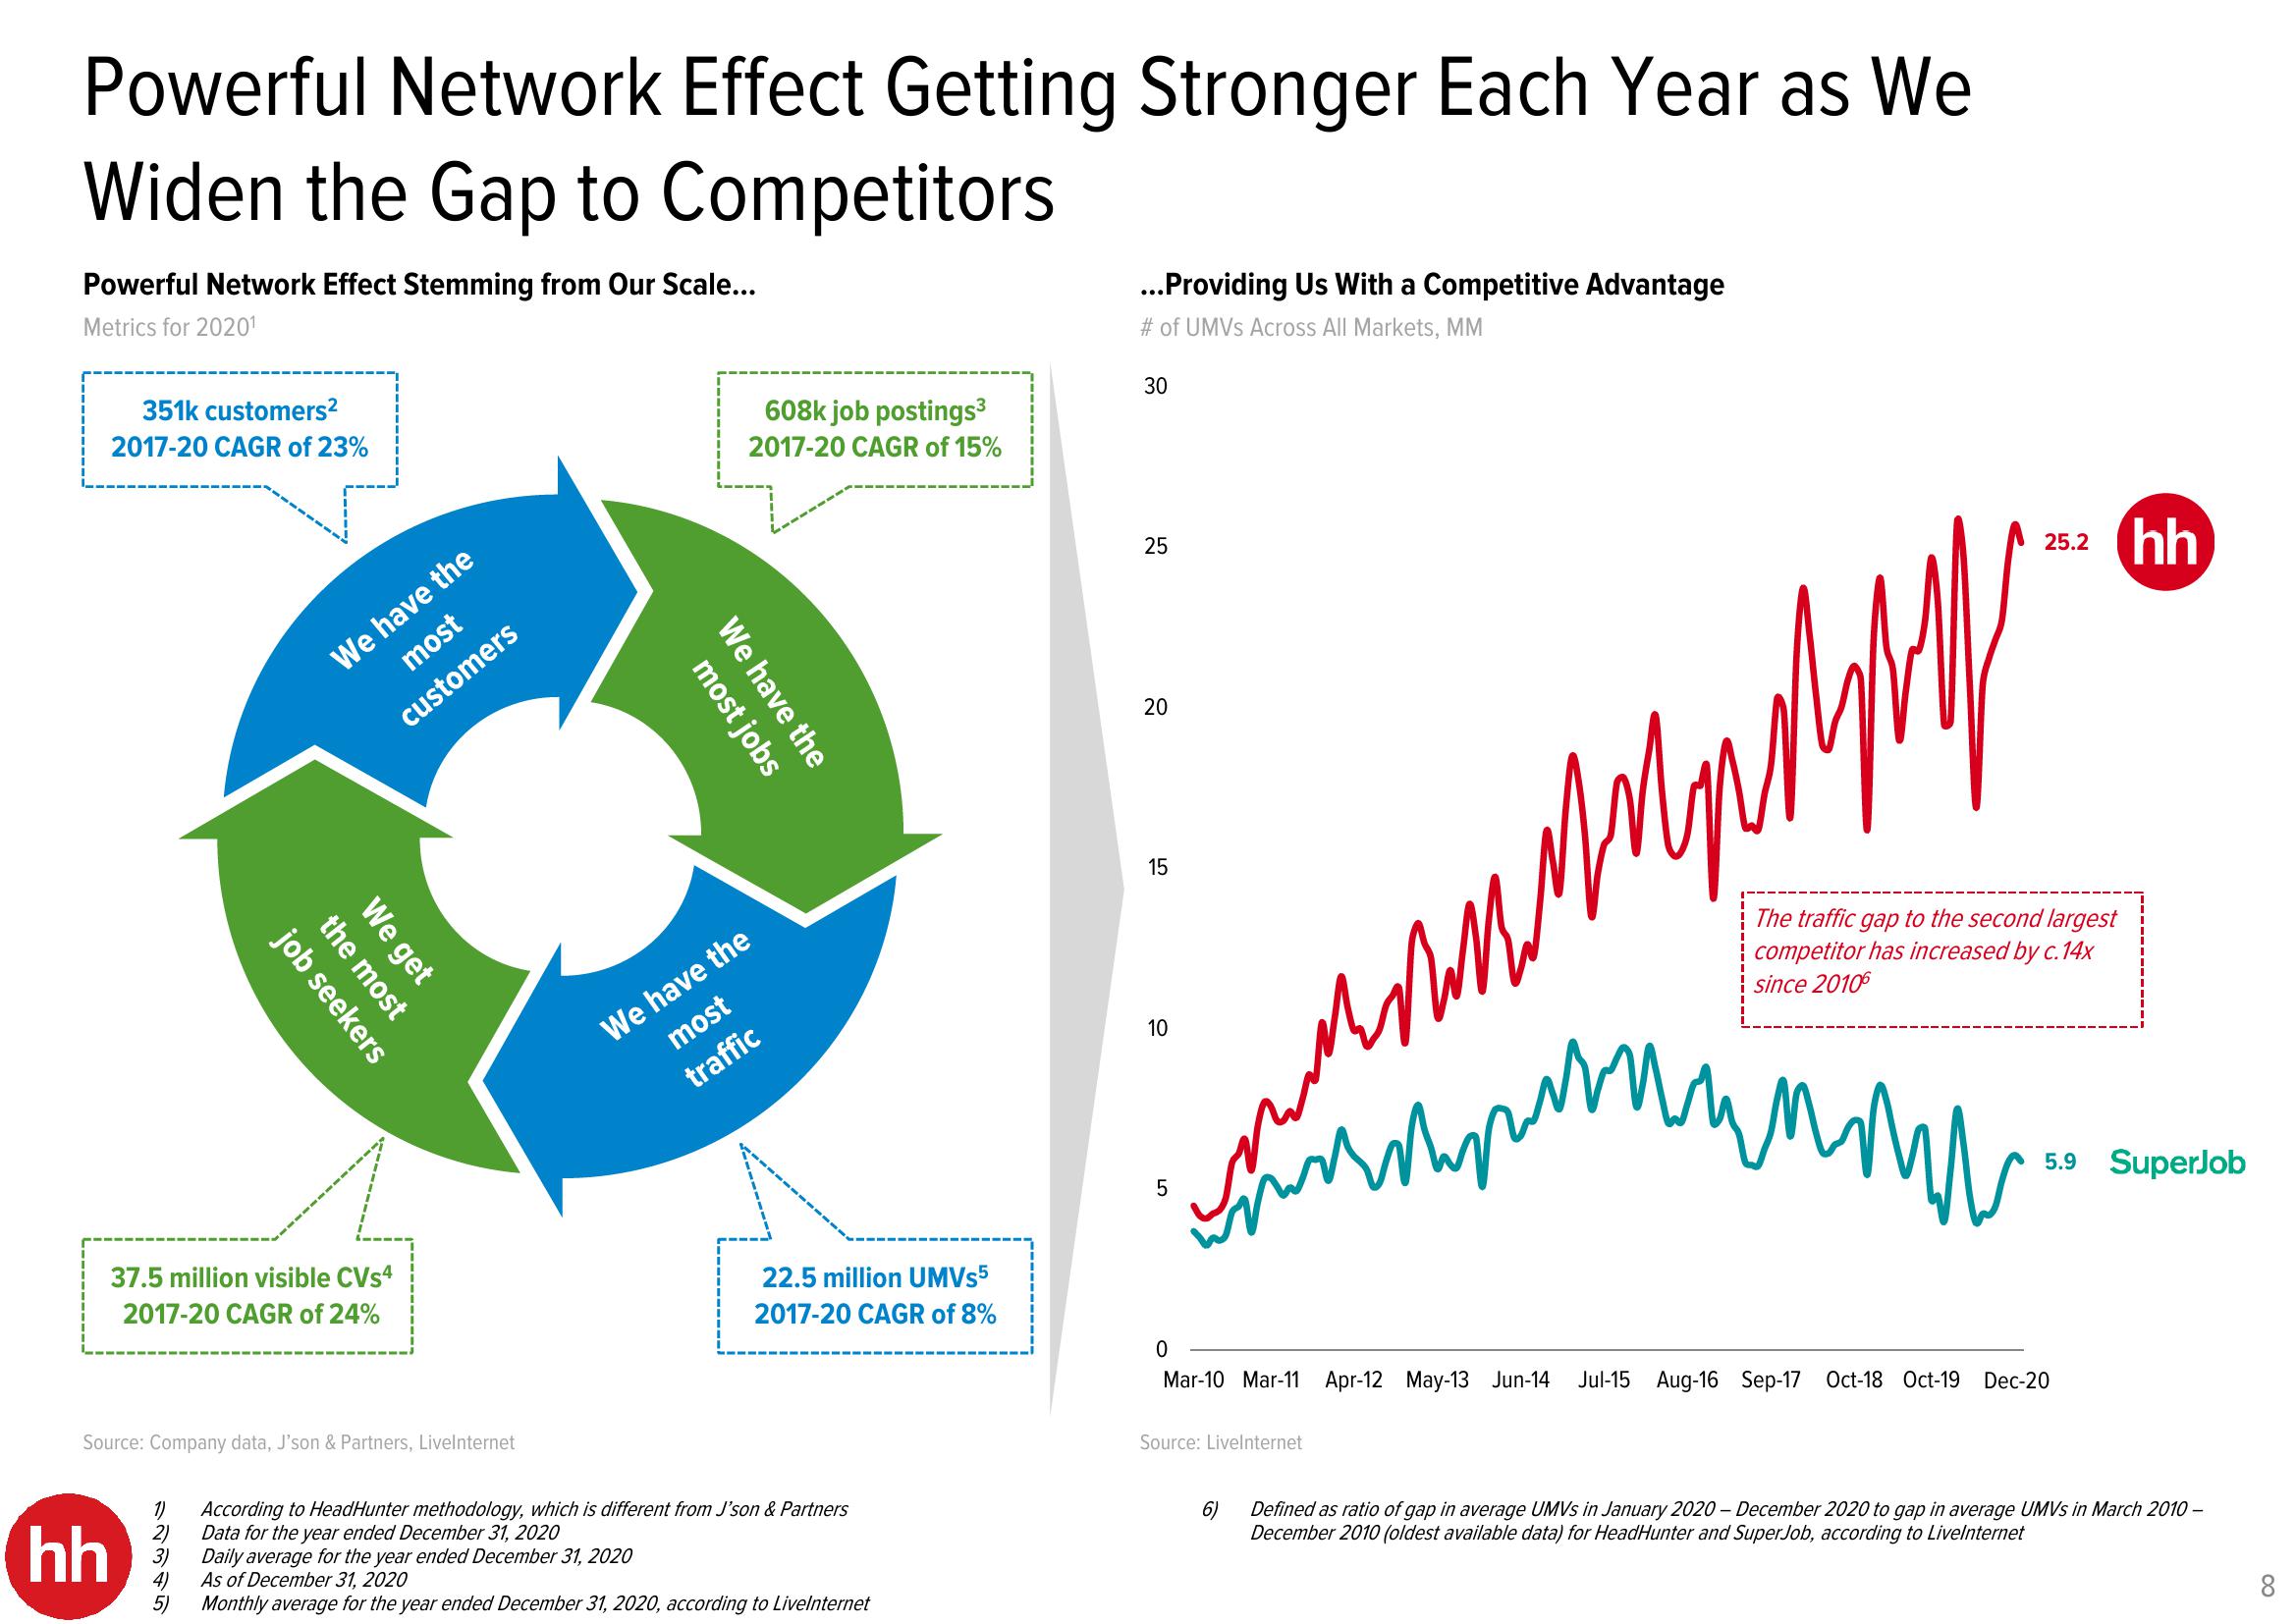
Powerful Network Effect Stemming from Our Scale...
Metrics for 2020¹
351k customers²
2017-20 CAGR of 23%
37.5 million visible CVs4
2017-20 CAGR of 24%
hh
We have the
most
customers
Source: Company data, J'son & Partners, Livelnternet
1)
2)
We get
the most
job seekers
3)
4)
5)
608k job postings³
2017-20 CAGR of 15%
most jobs
We have the
We have the
most
traffic
22.5 million UMVS5
2017-20 CAGR of 8%
According to HeadHunter methodology, which is different from J'son & Partners
Data for the year ended December 31, 2020
Daily average for the year ended December 31, 2020
As of December 31, 2020
Monthly average for the year ended December 31, 2020, according to Livelnternet
...Providing Us With a Competitive Advantage
# of UMVS Across All Markets, MM
30
25
20
15
10
5
and pl
илимир
Киприпли
52
The traffic gap to the second largest
competitor has increased by c.14x
since 20106
Source: Livelnternet
6)
0
Mar-10 Mar-11 Apr-12 May-13 Jun-14 Jul-15 Aug-16 Sep-17 Oct-18 Oct-19 Dec-20
hh
5.9 SuperJob
Defined as ratio of gap in average UMVS in January 2020 - December 2020 to gap in average UMVS in March 2010 -
December 2010 (oldest available data) for HeadHunter and SuperJob, according to Livelnternet
80View entire presentation