Bed Bath & Beyond Results Presentation Deck
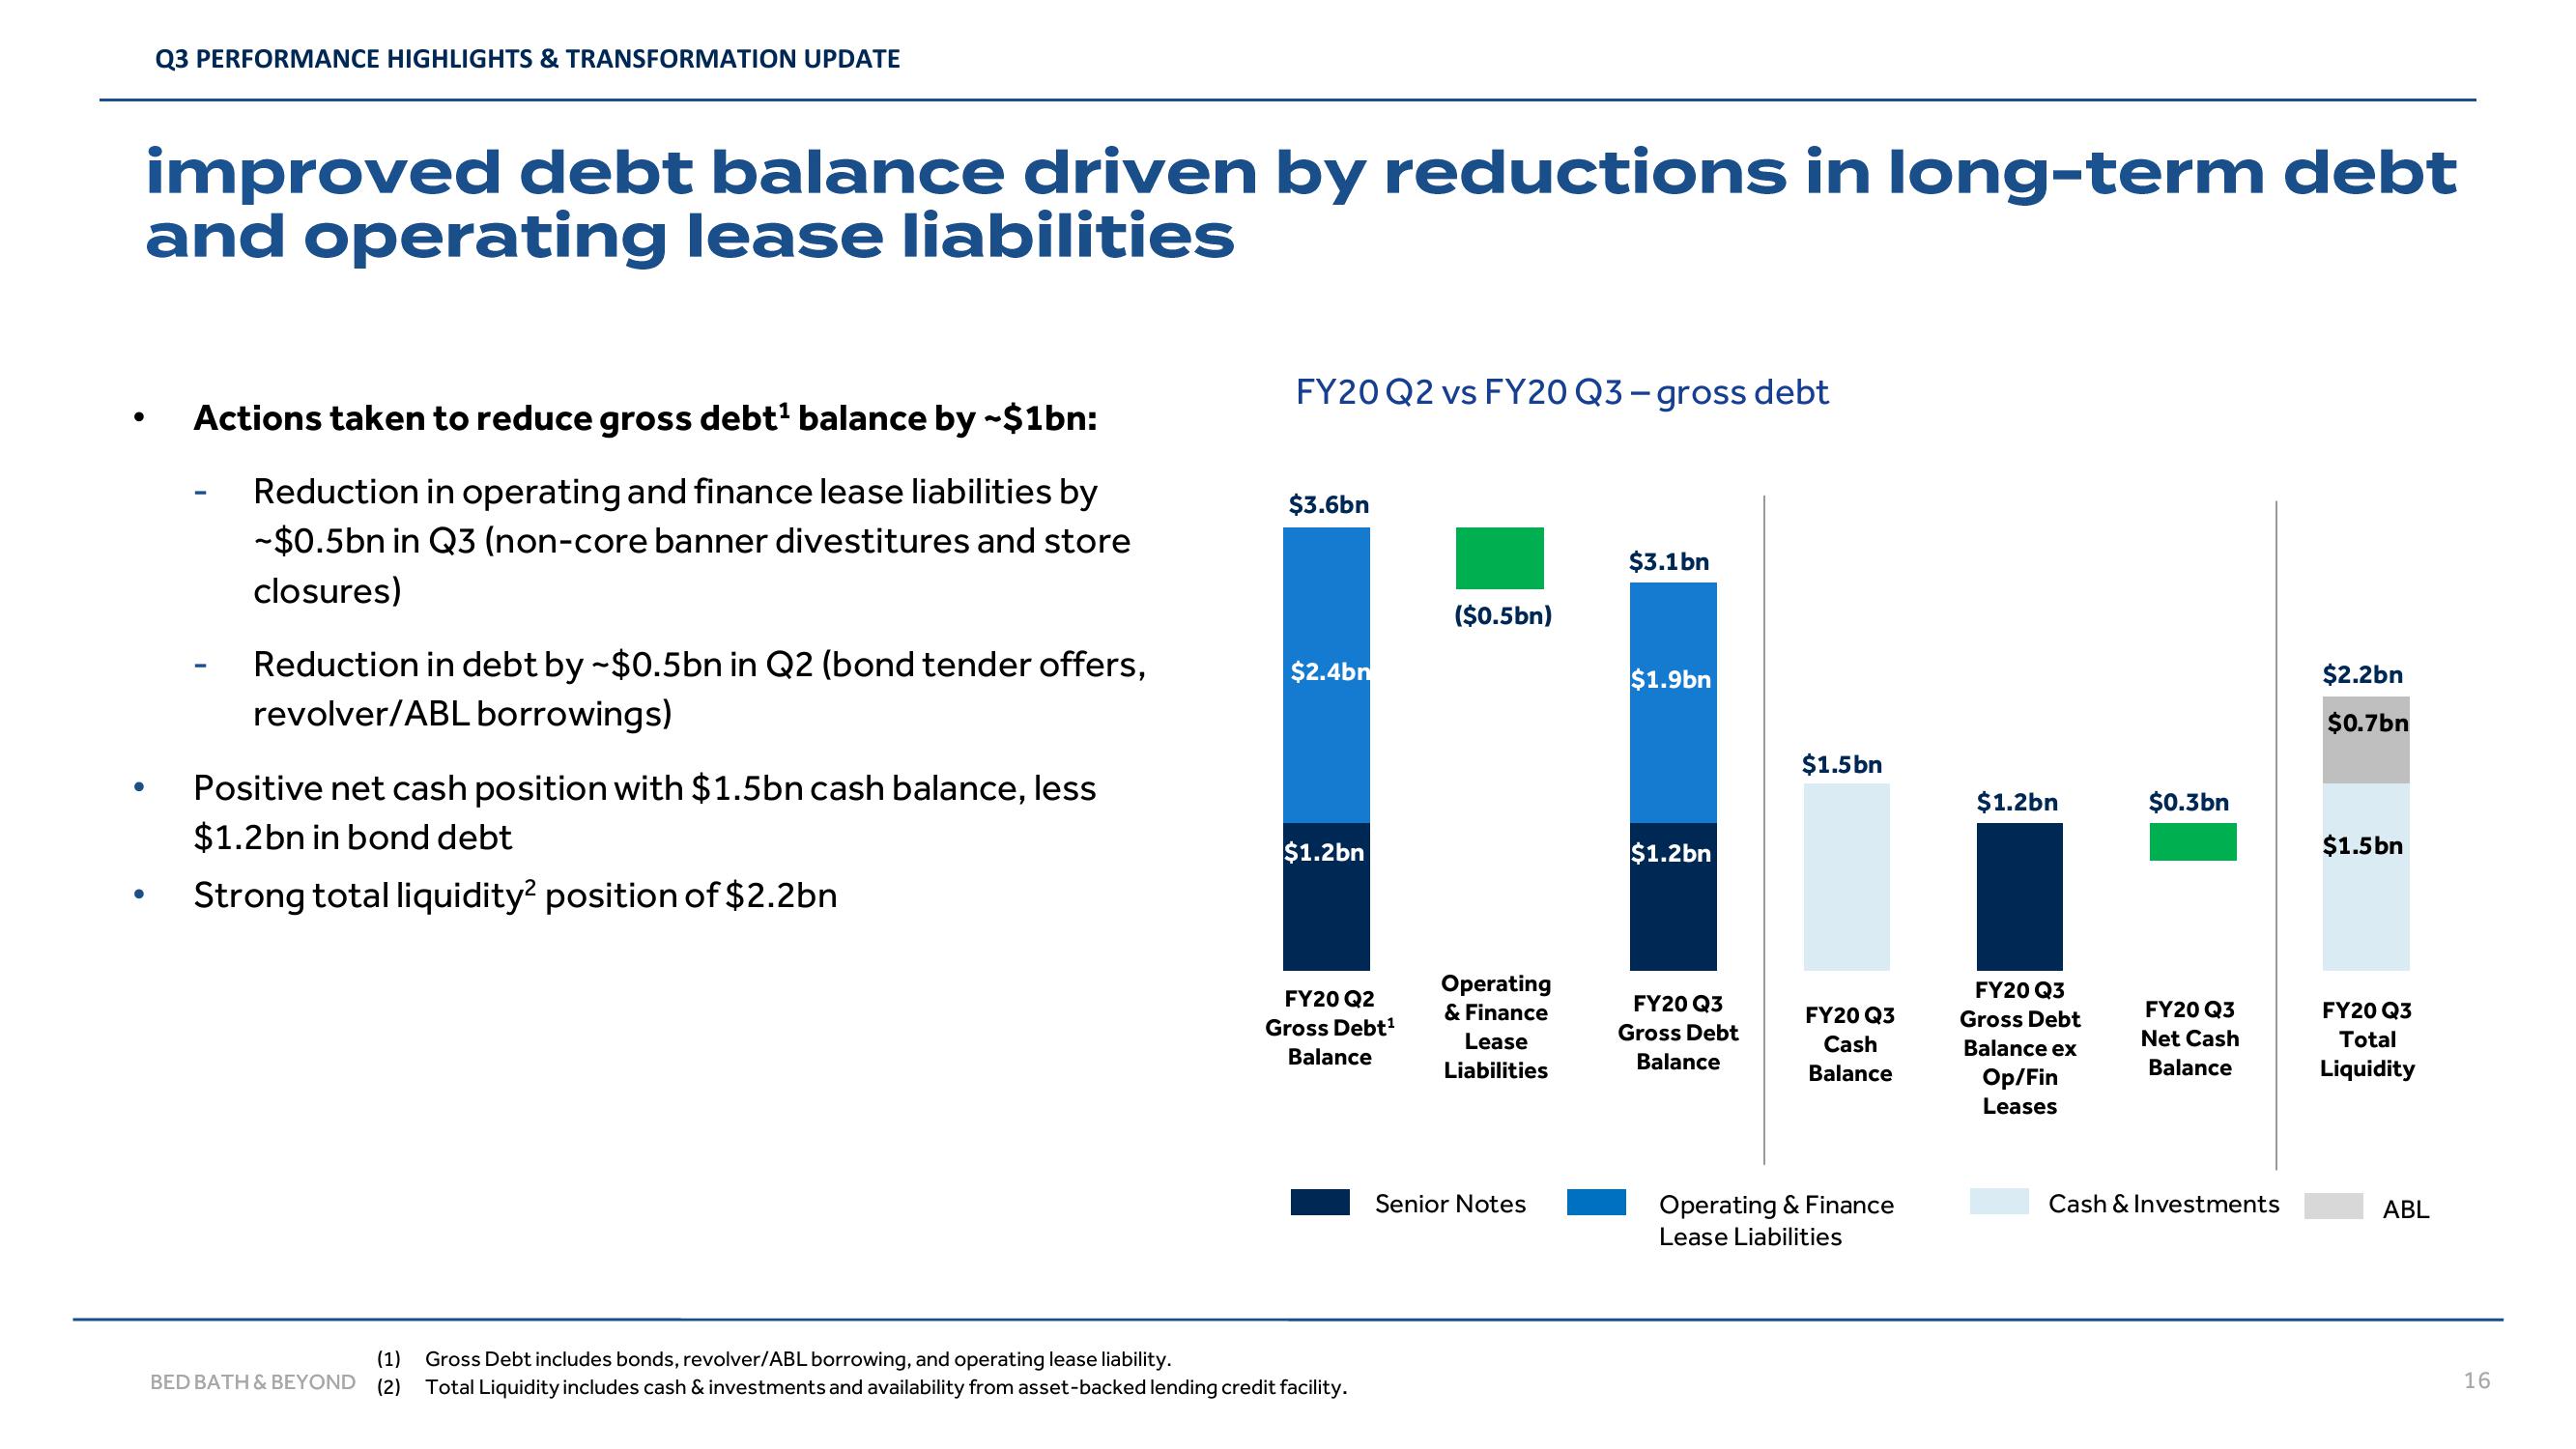
improved debt balance driven by reductions in long-term debt
and operating lease liabilities
●
Q3 PERFORMANCE HIGHLIGHTS & TRANSFORMATION UPDATE
●
Actions taken to reduce gross debt¹ balance by ~$1bn:
Reduction in operating and finance lease liabilities by
-$0.5bn in Q3 (non-core banner divestitures and store
closures)
Reduction in debt by ~$0.5bn in Q2 (bond tender offers,
revolver/ABL borrowings)
Positive net cash position with $1.5bn cash balance, less
$1.2bn in bond debt
Strong total liquidity2 position of $2.2bn
FY20 Q2 vs FY20 Q3 - gross debt
BED BATH & BEYOND (2)
$3.6bn
$2.4bn
$1.2bn
FY20 Q2
Gross Debt¹
Balance
(1) Gross Debt includes bonds, revolver/ABL borrowing, and operating lease liability.
Total Liquidity includes cash & investments and availability from asset-backed lending credit facility.
($0.5bn)
Operating
& Finance
Lease
Liabilities
Senior Notes
$3.1bn
$1.9bn
$1.2bn
FY20 Q3
Gross Debt
Balance
$1.5bn
FY20 Q3
Cash
Balance
Operating & Finance
Lease Liabilities
$1.2bn
FY20 Q3
Gross Debt
Balance ex
Op/Fin
Leases
$0.3bn
FY20 Q3
Net Cash
Balance
Cash & Investments
$2.2bn
$0.7bn
$1.5bn
FY20 Q3
Total
Liquidity
ABL
16View entire presentation