Allwyn Results Presentation Deck
Consolidated P&L
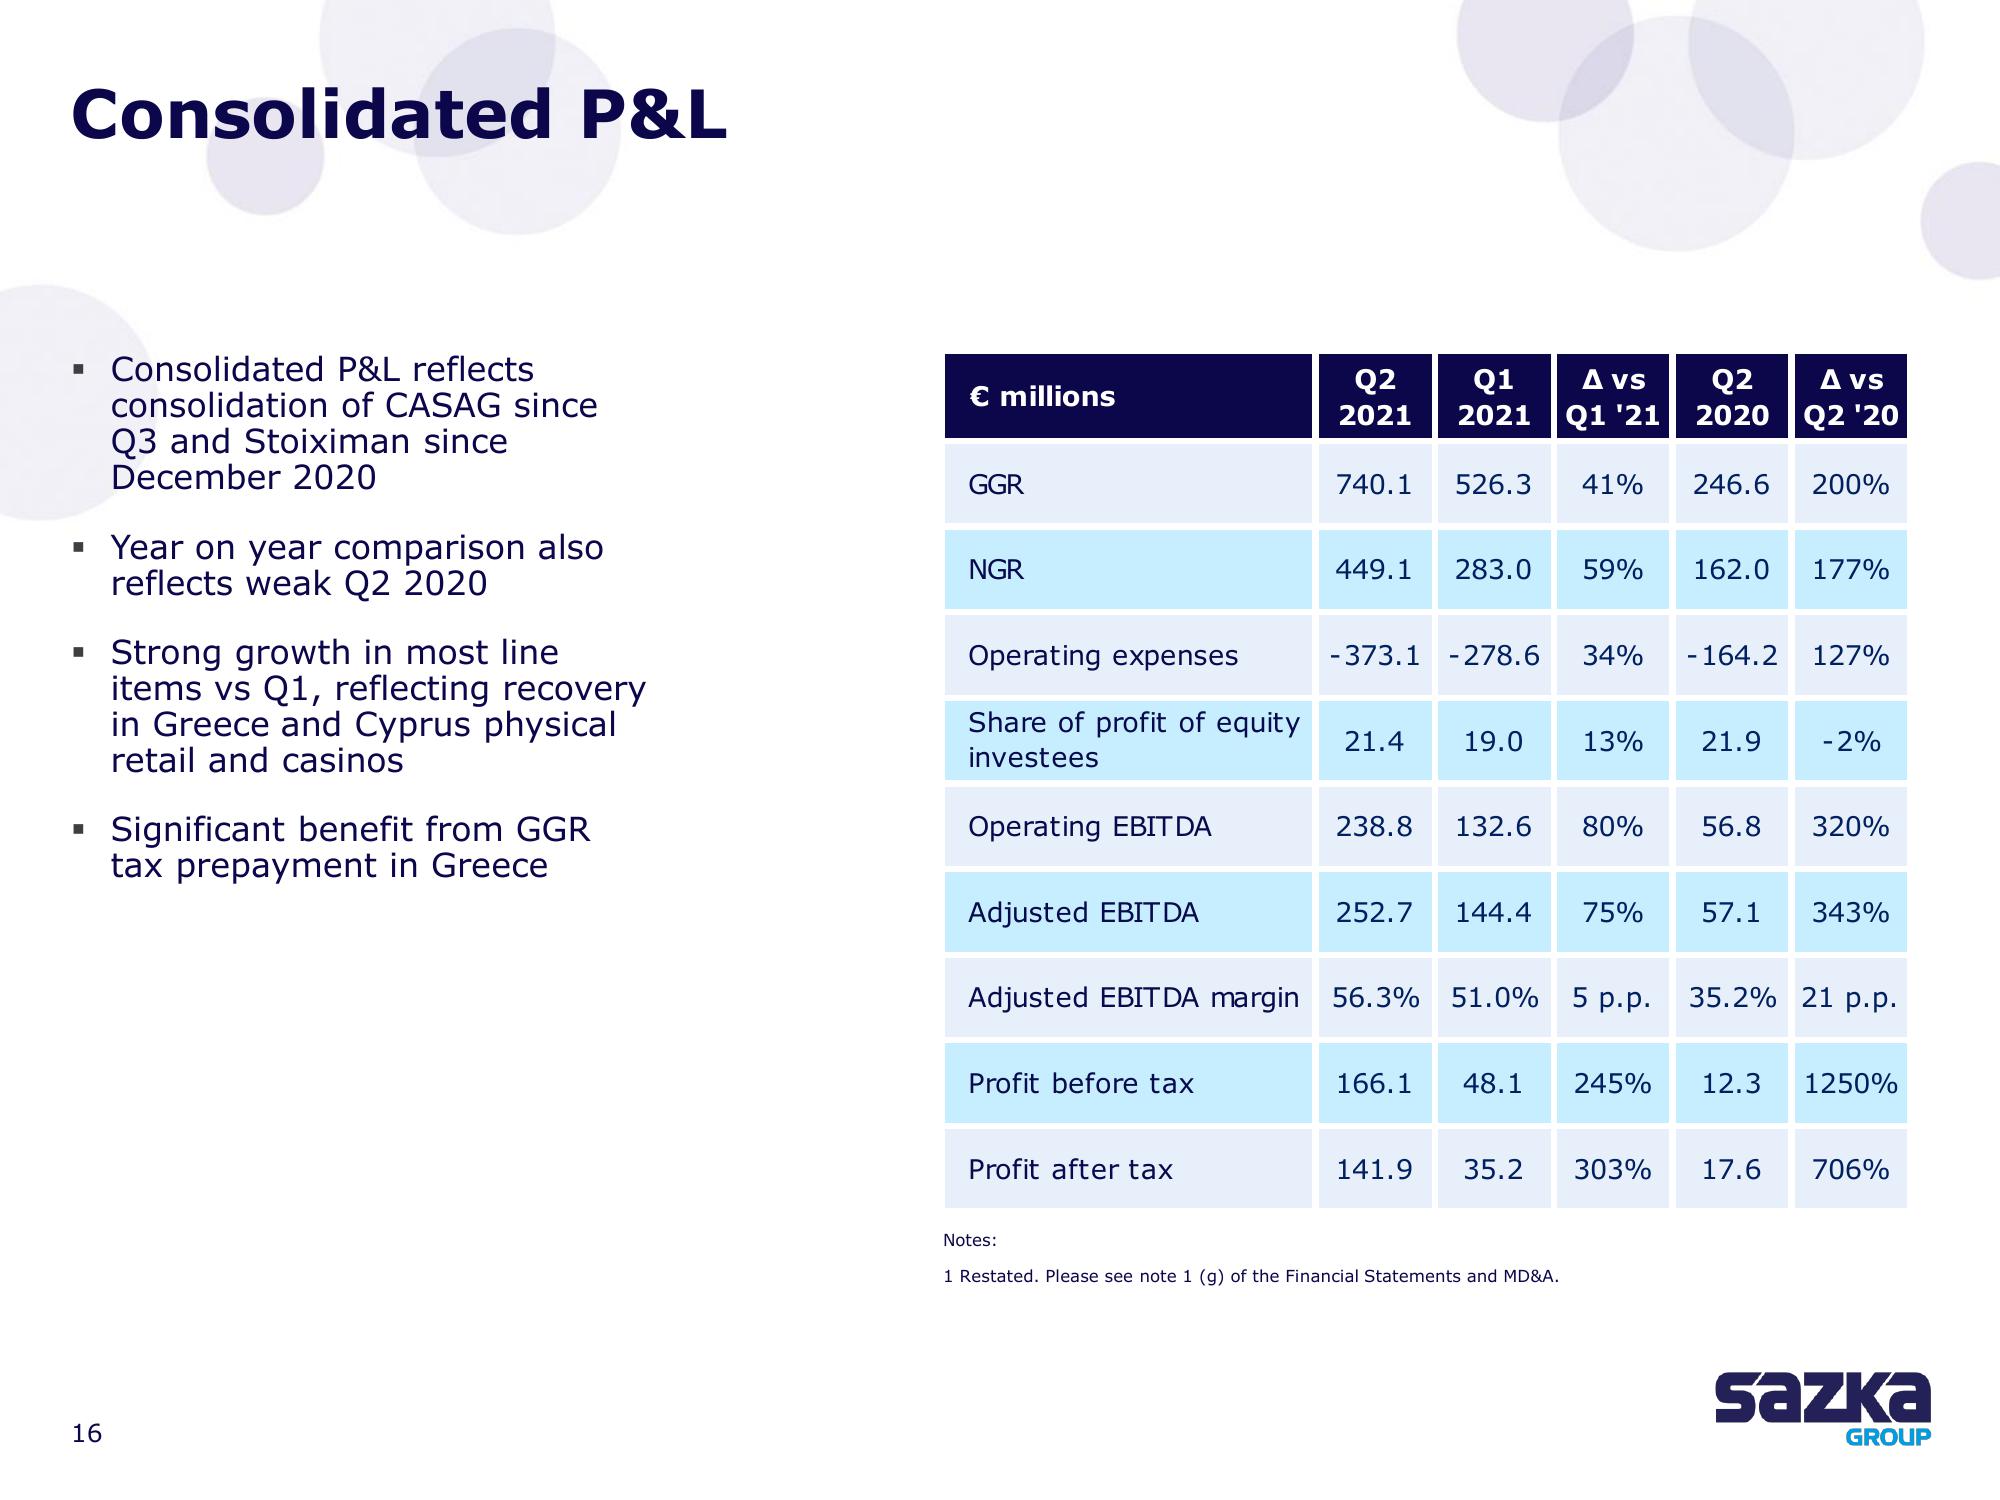
■ Consolidated P&L reflects
consolidation of CASAG since
Q3 and Stoiximan since
December 2020
▪ Year on year comparison also
reflects weak Q2 2020
I
16
Strong growth in most line
items vs Q1, reflecting recovery
in Greece and Cyprus physical
retail and casinos
Significant benefit from GGR
tax prepayment in Greece
€ millions
GGR
NGR
Operating expenses
Share of profit of equity
investees
Operating EBIT DA
Adjusted EBIT DA
Profit before tax
Profit after tax
Q2
2021
Notes:
740.1
449.1
Q1
2021
21.4
-373.1 -278.6
526.3 41% 246.6
283.0 59%
19.0
Adjusted EBITDA margin 56.3% 51.0%
238.8 132.6
A vs
Q1 '21
141.9 35.2
34%
252.7 144.4 75%
1 Restated. Please see note 1 (g) of the Financial Statements and MD&A.
13%
166.1 48.1 245%
5 p.p.
Q2
2020
80% 56.8
303%
162.0
- 164.2
21.9
57.1
A vs
Q2 '20
200%
17.6
177%
127%
- 2%
320%
343%
35.2% 21 p.p.
12.3 1250%
706%
Sazka
GROUPView entire presentation