Silicon Valley Bank Results Presentation Deck
We've successfully
navigated economic
cycles before
Proven leadership
supported by strong
global team
14 years
Executive management
average tenure at SVB
24 years
Credit leadership average
tenure at SVB
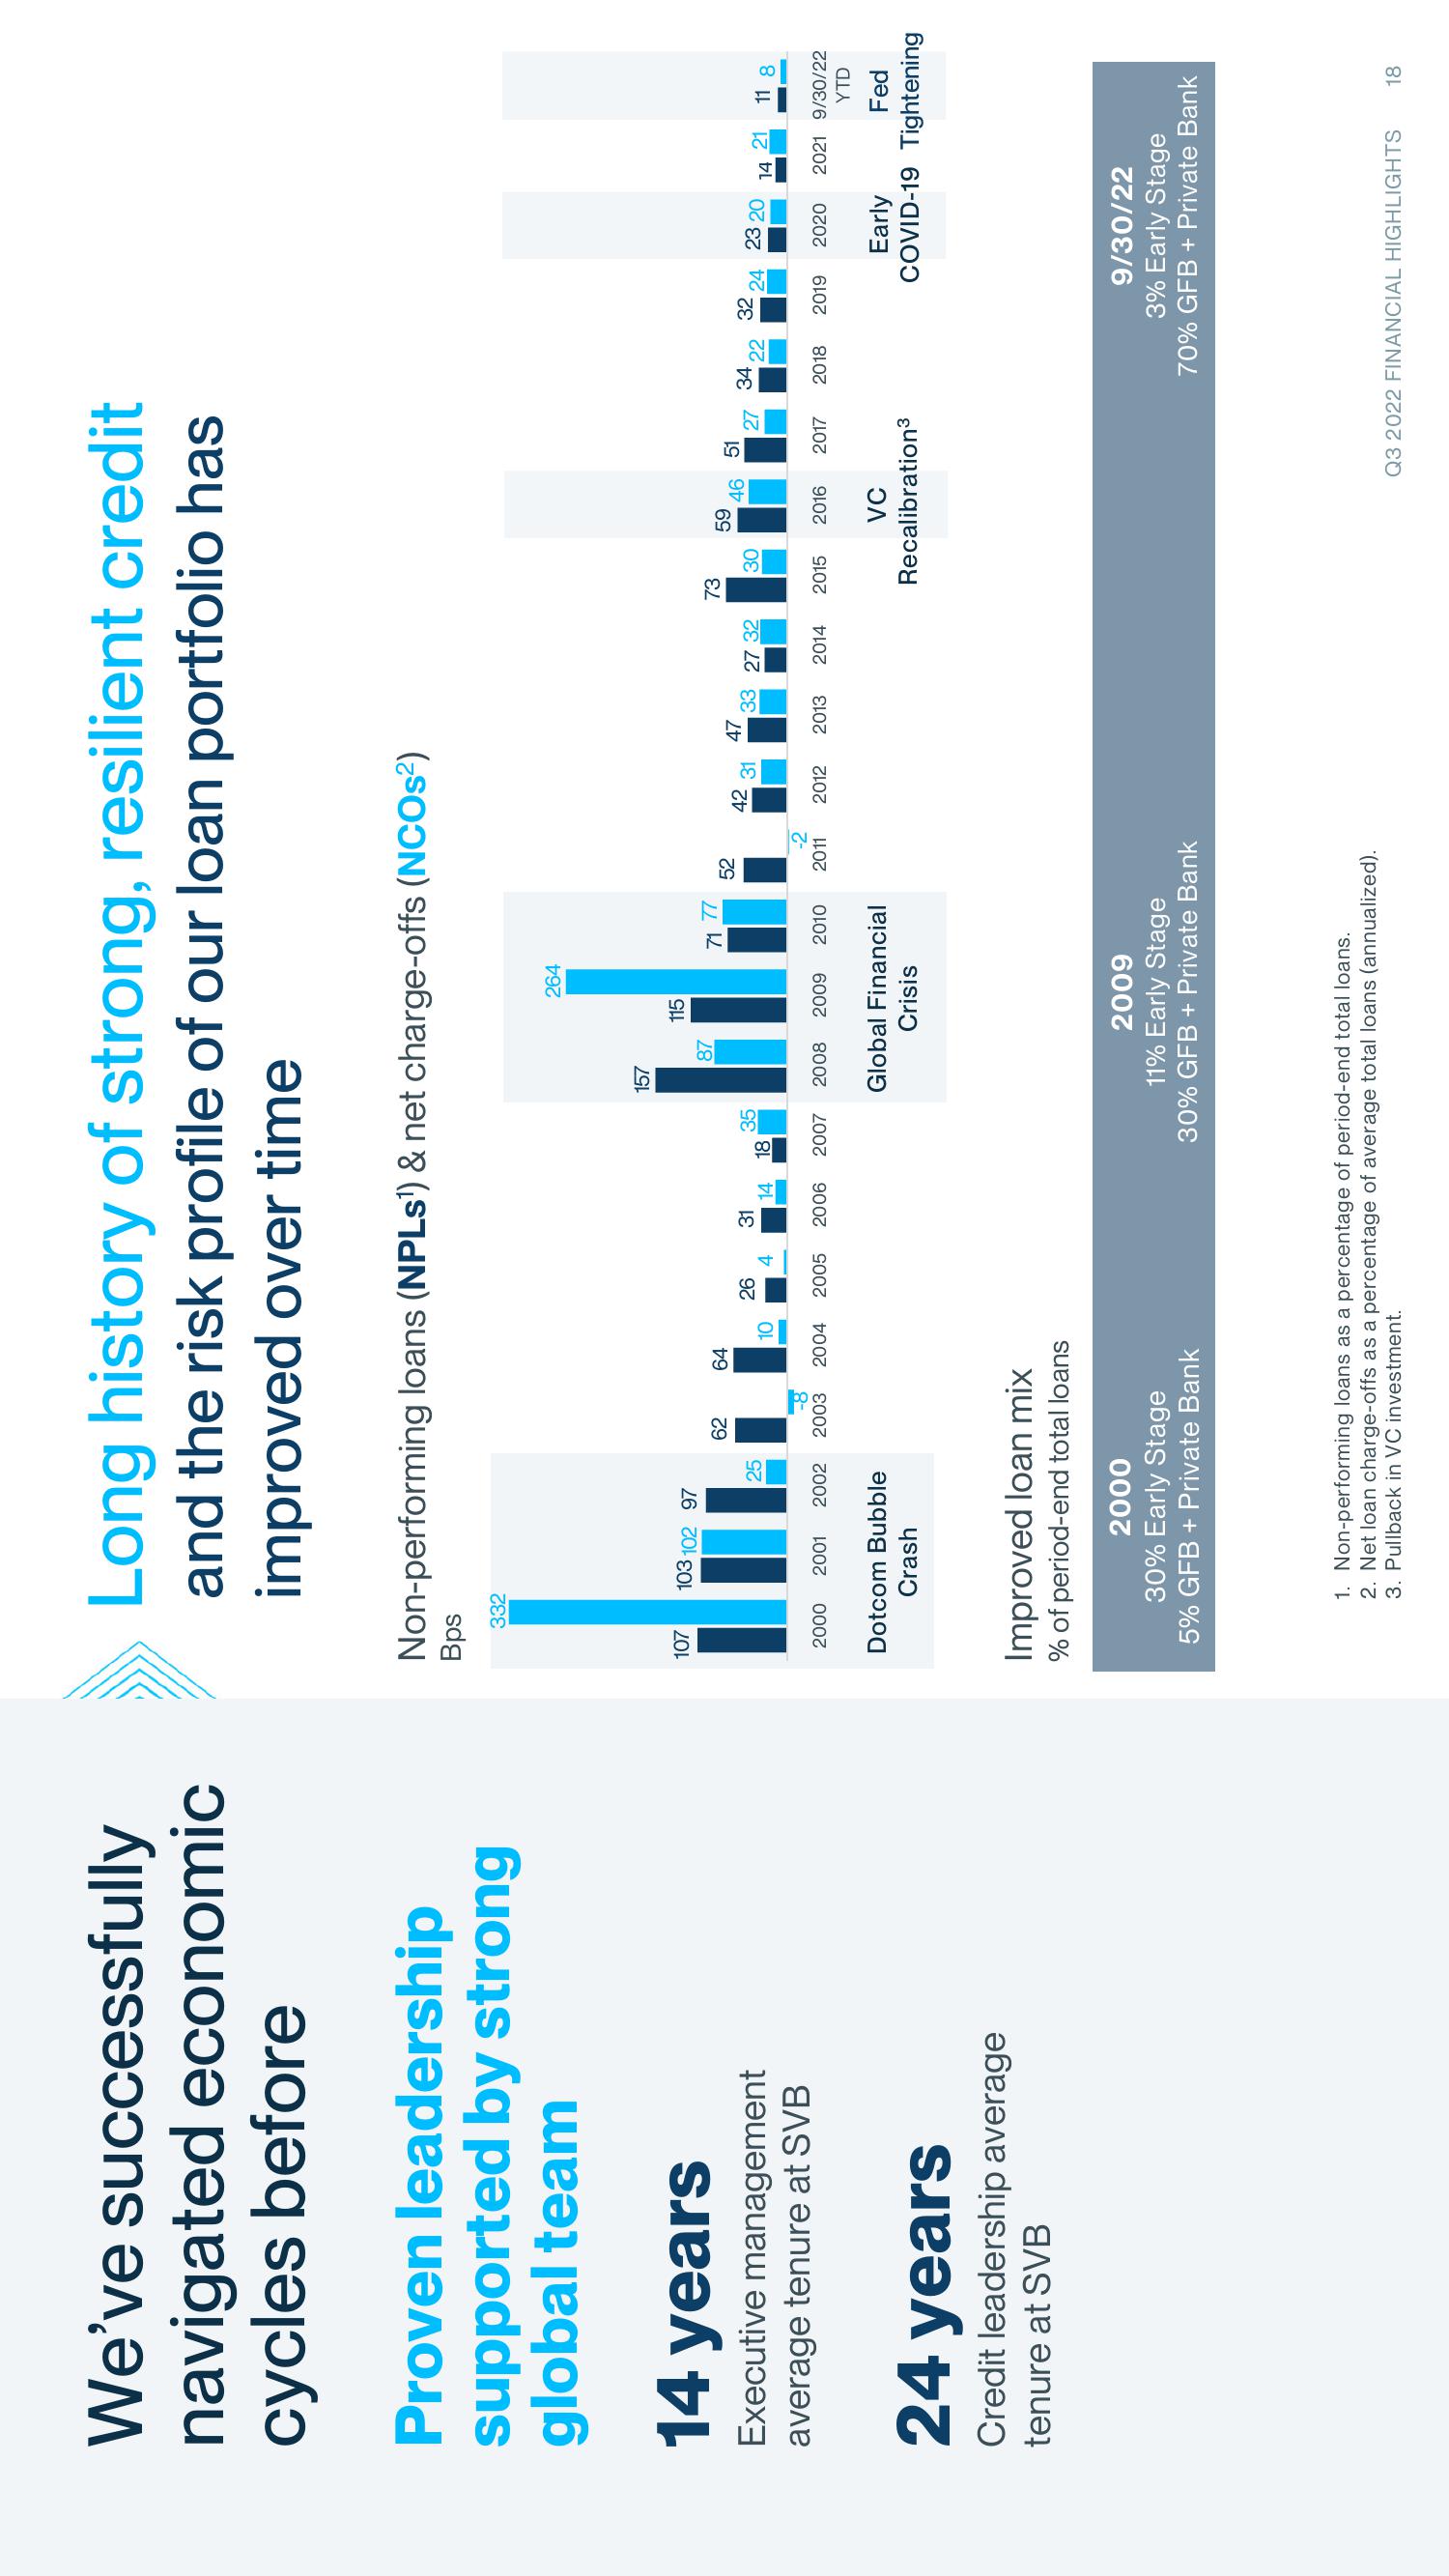
Non-performing loans (NPLs¹) & net charge-offs (NCOs²)
Bps
Long history of strong, resilient credit
and the risk profile of our loan portfolio has
improved over time
107
332
103 102 97
25
2000 2001 2002
Dotcom Bubble
Crash
62
64
10
Improved loan mix
% of period-end total loans
2000
30% Early Stage
5% GFB+ Private Bank
26
-8
2003 2004 2005
4
31
14 18
2006
35
2007
157
87
264
115
71 77
2008 2009 2010
Global Financial
Crisis
52
-2
2011
2009
11% Early Stage
30% GFB + Private Bank
1. Non-performing loans as a percentage of period-end total loans.
2. Net loan charge-offs as a percentage of average total loans (annualized).
3. Pullback in VC investment.
47
42 31
33 27 32
2012 2013
2014
73
30
59
46 51
2015 2016
32
27 34 22 24 23 20
2017
VC
Recalibration³
14 21 11 8
2018 2019 2020 2021 9/30/22
YTD
Fed
Early
COVID-19 Tightening
9/30/22
3% Early Stage
70% GFB + Private Bank
Q3 2022 FINANCIAL HIGHLIGHTS 18View entire presentation