Nikola Results Presentation Deck
NIKOLA.
PAGE/1 1
FINANCIAL OVERVIEW
In Thousands
Except Share and per Share Data
Revenues:
Truck sales
Service and other (1)
Cost of revenues:
Gross profit
Total revenues
Truck sales
Service and other (1)
Total cost of revenues
Operating expenses:
Net loss
Research and development
Selling, general, and administrative
Total operating expenses
Loss from operations
Interest expense, net
Revaluation of warrant liability.
Other income, net
Loss before income taxes and equity in net loss of affiliates
Income tax expense
Loss before equity in net loss of affiliates
Equity in net loss of affiliates
Net loss per share, basic
Net loss per share, diluted (2)
Weighted-average shares outstanding, basic
Weighted-average shares outstanding, diluted (3)
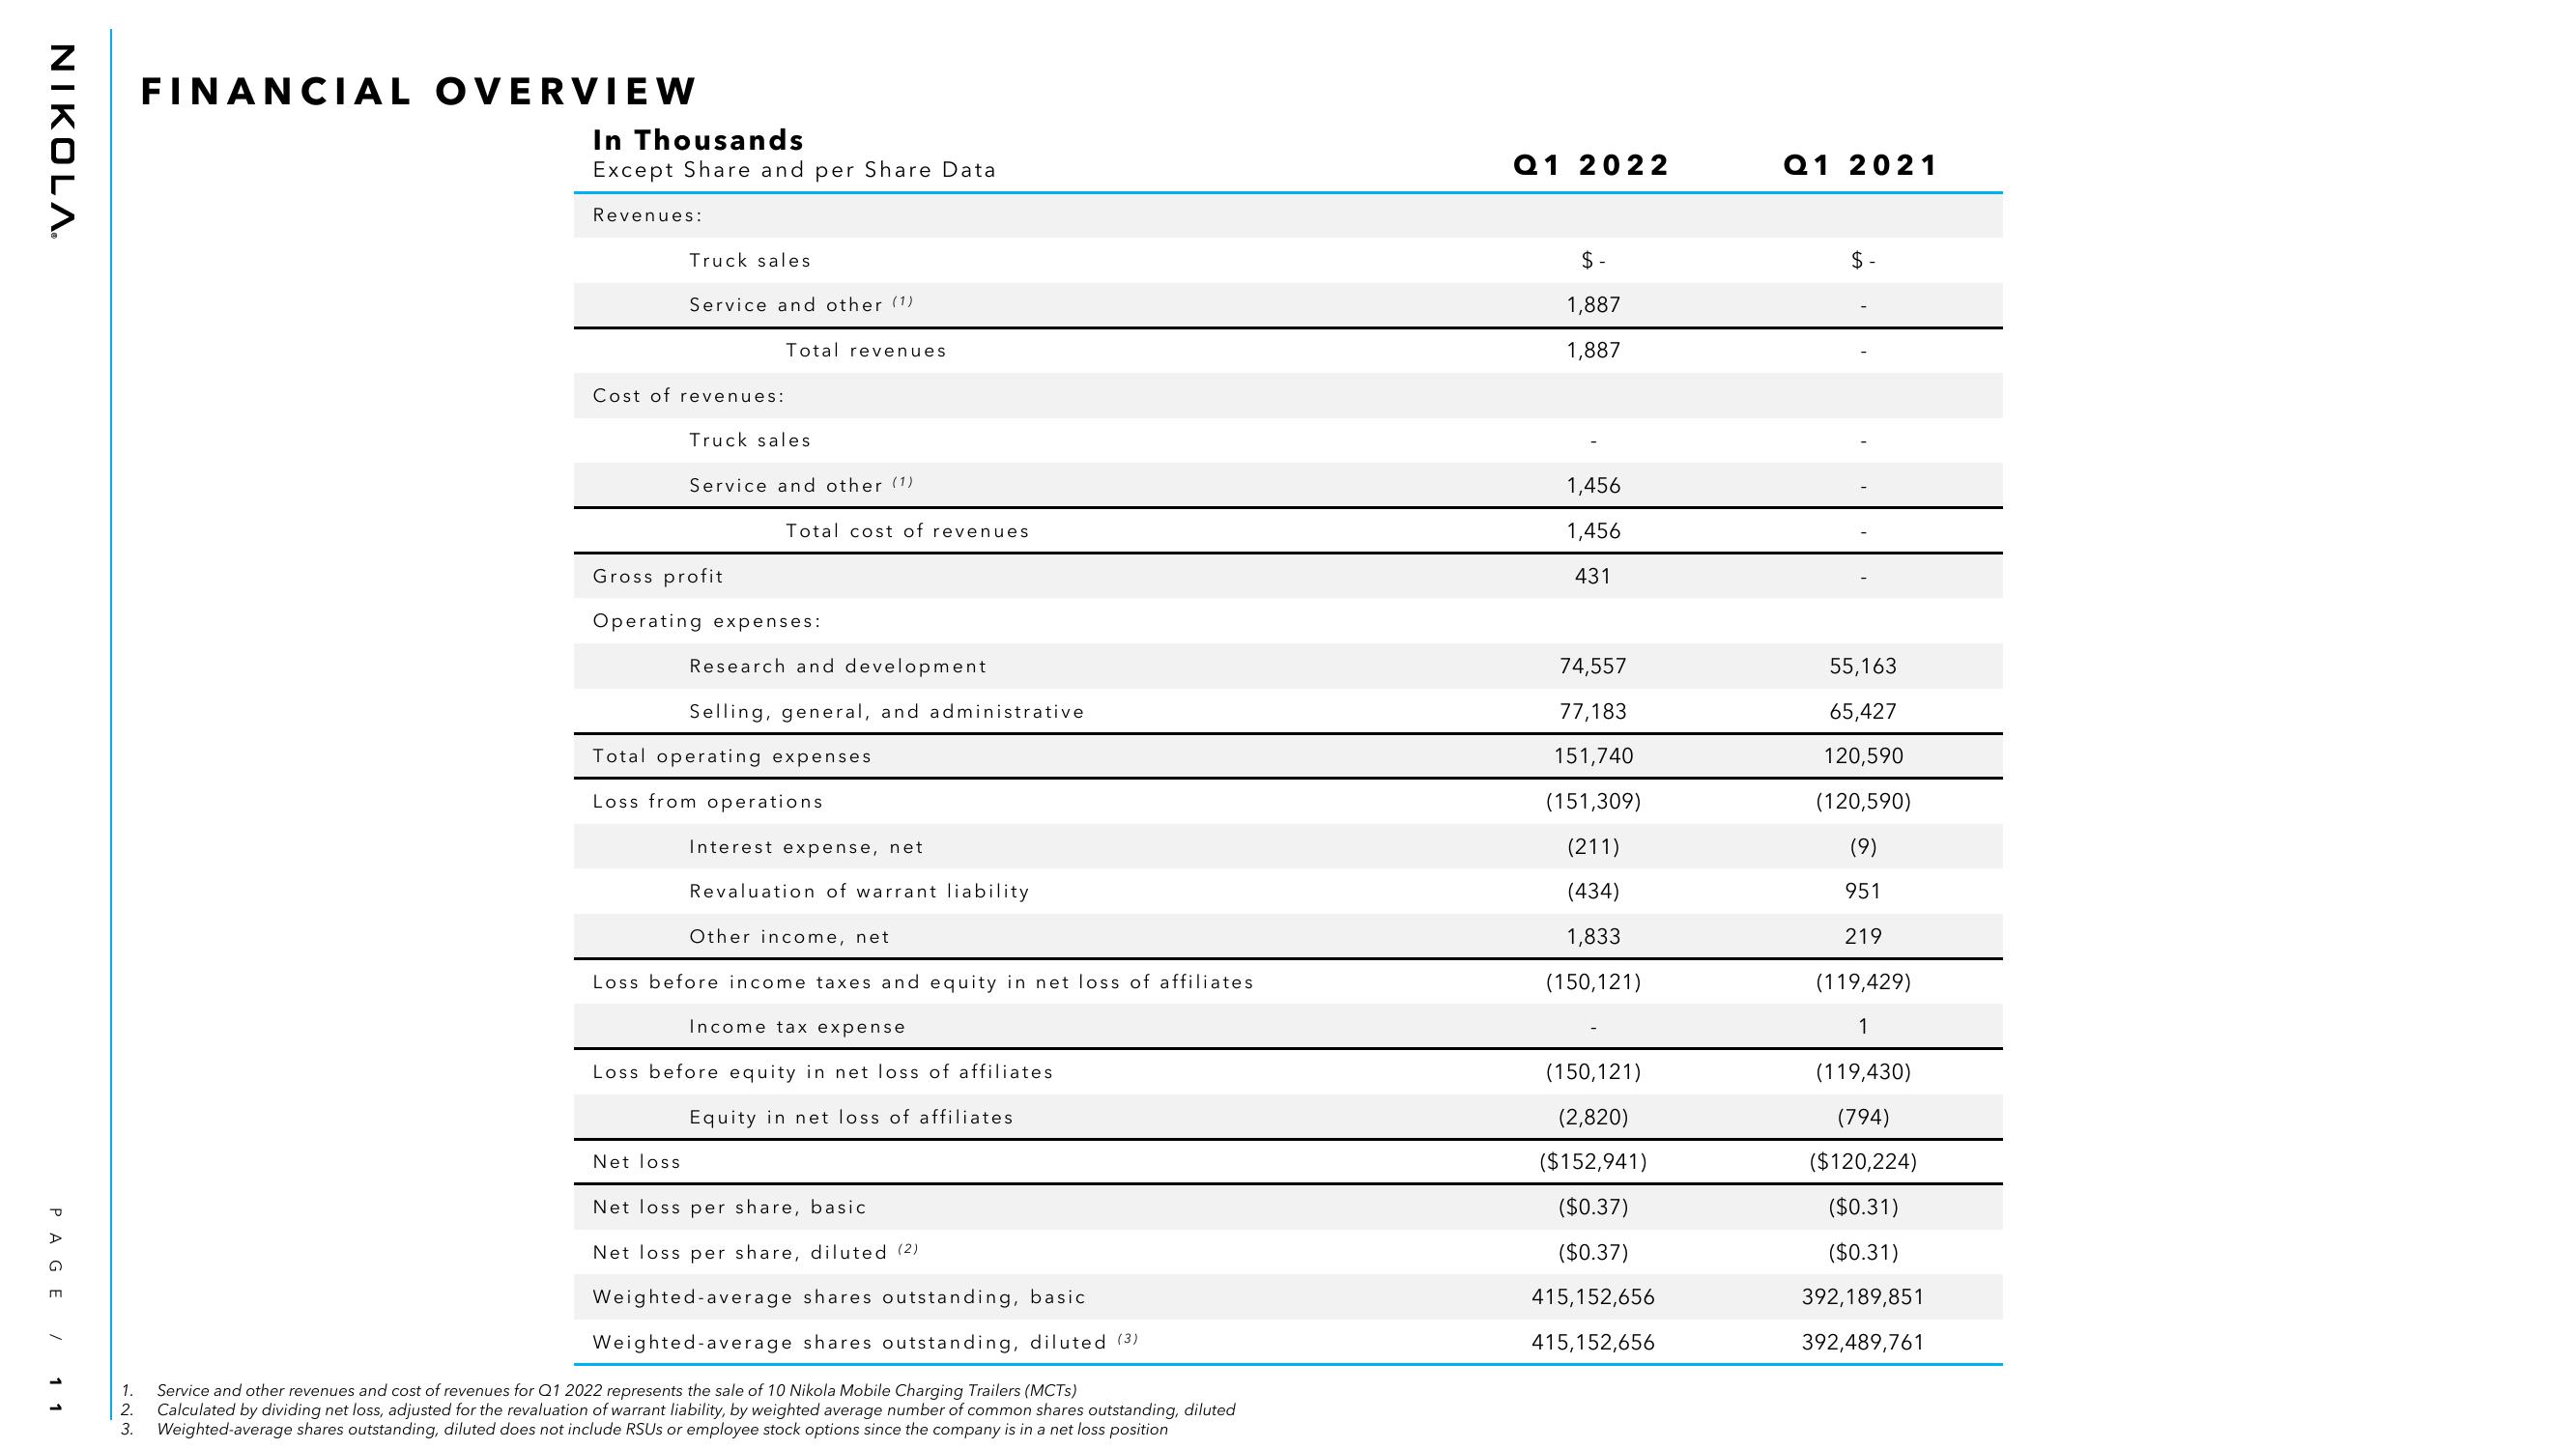
1. Service and other revenues and cost of revenues for Q1 2022 represents the sale of 10 Nikola Mobile Charging Trailers (MCTS)
2. Calculated by dividing net loss, adjusted for the revaluation of warrant liability, by weighted average number of common shares outstanding, diluted
3. Weighted-average shares outstanding, diluted does not include RSUS or employee stock options since the company is in a net loss position
Q1 2022
$-
1,887
1,887
1,456
1,456
431
74,557
77,183
151,740
(151,309)
(211)
(434)
1,833
(150,121)
(150,121)
(2,820)
($152,941)
($0.37)
($0.37)
415,152,656
415,152,656
Q1 2021
$-
55,163
65,427
120,590
(120,590)
(9)
951
219
(119,429)
1
(119,430)
(794)
($120,224)
($0.31)
($0.31)
392,189,851
392,489,761View entire presentation