Trian Partners Activist Presentation Deck
Confidential-Not for Reproduction or Distribution
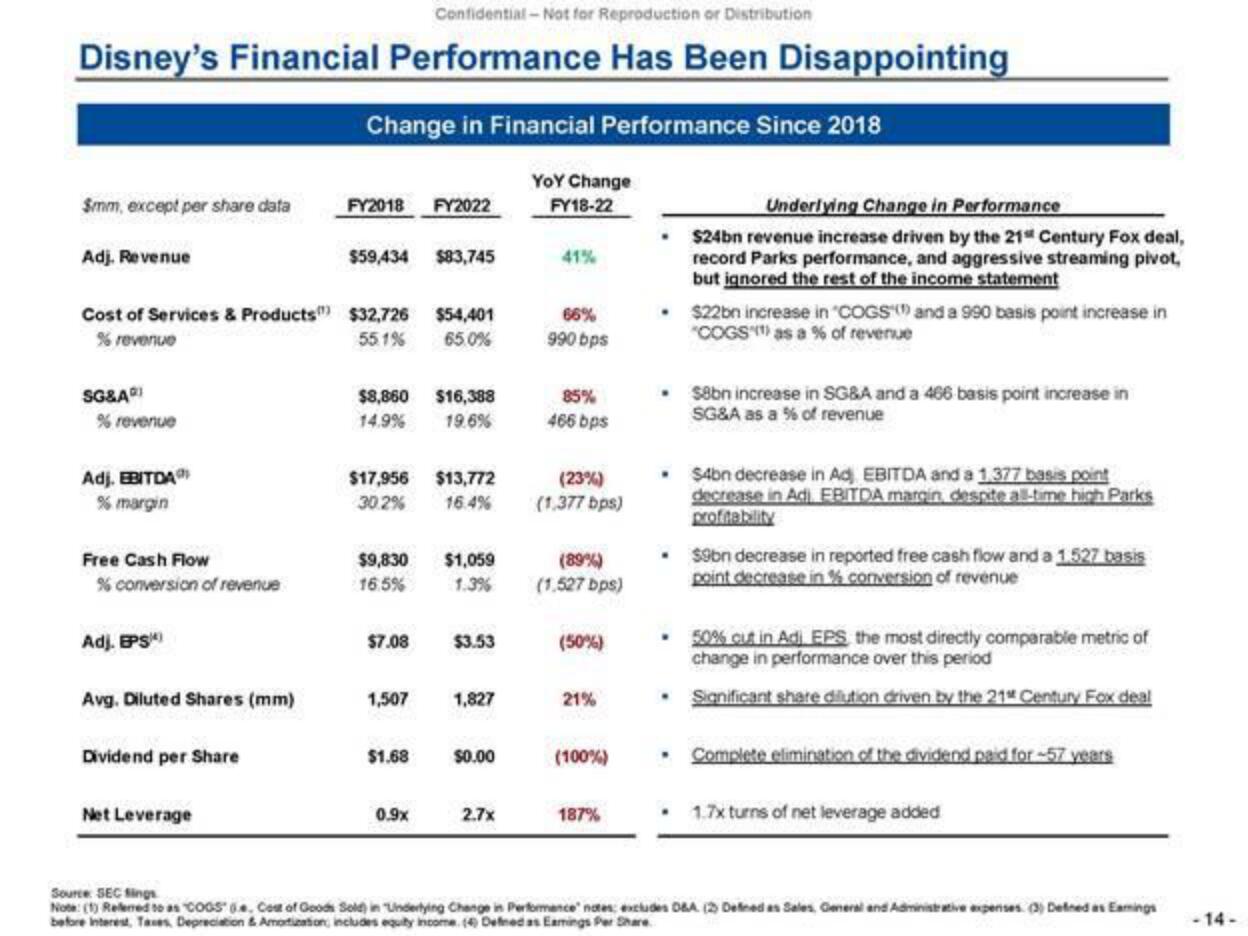
Disney's Financial Performance Has Been Disappointing
$mm, except per share data
Adj. Revenue
SG&A
Cost of Services & Products $32,726
% revenue
551%
% revenue
Adj. EBITDA
% margin
Free Cash Flow
% conversion of revenue
Adj. EPS)
Avg. Diluted Shares (mm)
Dividend per Share
Change in Financial Performance Since 2018
Net Leverage
FY2018 FY2022
$59,434 $83,745
$8,860 $16,388
14.9% 19.6%
$17,956 $13,772
30.2%
16.4%
$9,830
16.5%
$7.08
$54,401
65.0%
$1.68
0.9x
$1,059
1.3%
1,507 1,827
$3.53
$0.00
2.7x
YOY Change
FY18-22
41%
66%
990 bps
85%
466 bps
(23%)
(1,377 bps)
(89%)
(1.527 bps)
(50%)
21%
(100%)
187%
Underlying Change in Performance
• $24bn revenue increase driven by the 21st Century Fox deal,
record Parks performance, and aggressive streaming pivot,
but ignored the rest of the income statement
.
.
.
$22bn increase in "COGS and a 990 basis point increase in
"COGS) as a % of revenue
.
$8bn increase in SG&A and a 466 basis point increase in
SG&A as a % of revenue
• $9bn decrease in reported free cash flow and a 1.527 basis
point decrease in % conversion of revenue
$4bn decrease in Ad EBITDA and a 1,377 basis point
decrease in Ad). EBITDA margin, despite all-time high Parks
profitability
50% cut in Adi EPS the most directly comparable metric of
change in performance over this period
Significant share dilution driven by the 21st Century Fox deal
• Complete elimination of the dividend paid for-57 years
1.7x turns of net leverage added
Source SEC fings
Note: (1) Relemed to as "COGS" (e, Cost of Goods Sold) in "Underlying Change in Performance notes: excludes D&A (2) Defined as Sales, General and Administrative expenses (3) Defined as Earnings
before interest, Taves, Depreciation & Amortization, includes equity income (4) Defined as Eamings Per Share
-14-View entire presentation