Apollo Global Management Investor Day Presentation Deck
Mid Cap's Economic Model
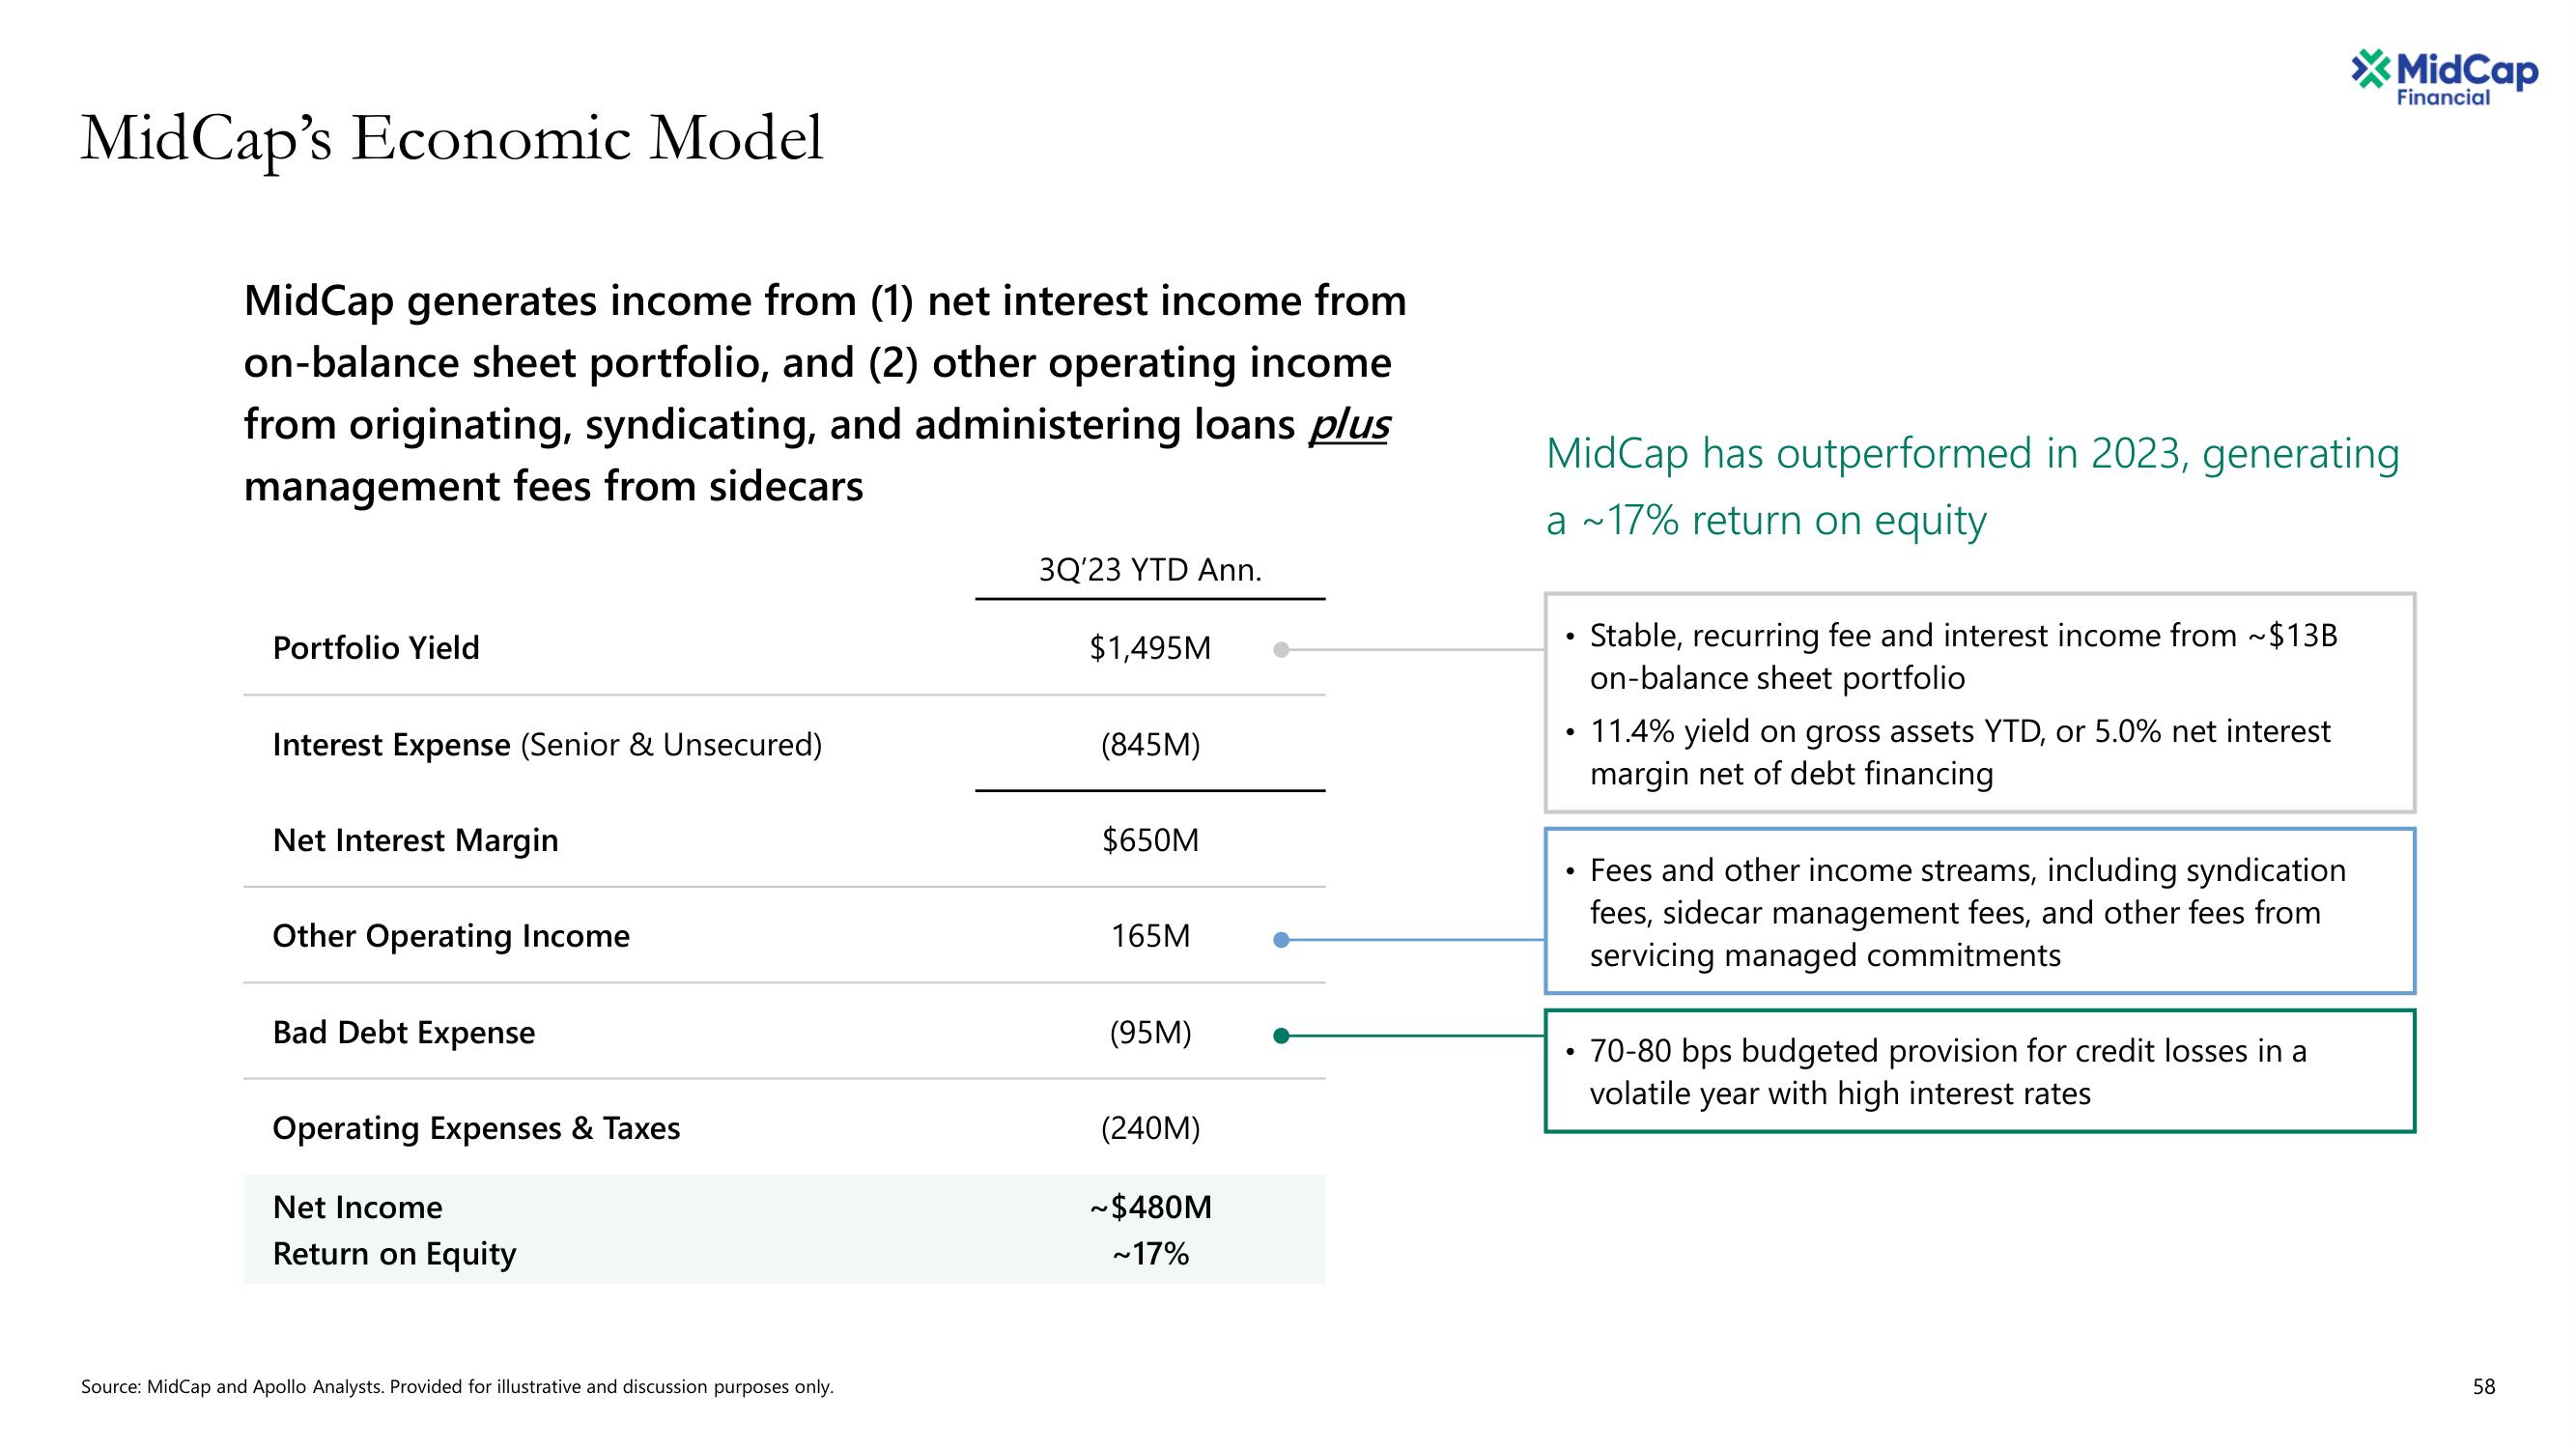
MidCap generates income from (1) net interest income from
on-balance sheet portfolio, and (2) other operating income
from originating, syndicating, and administering loans plus
management fees from sidecars
Portfolio Yield
Interest Expense (Senior & Unsecured)
Net Interest Margin
Other Operating Income
Bad Debt Expense
Operating Expenses & Taxes
Net Income
Return on Equity
Source: MidCap and Apollo Analysts. Provided for illustrative and discussion purposes only.
3Q'23 YTD Ann.
$1,495M
(845M)
$650M
165M
(95M)
(240M)
~$480M
~17%
MidCap has outperformed in 2023, generating
a ~17% return on equity
●
●
●
●
Stable, recurring fee and interest income from ~$13B
on-balance sheet portfolio
11.4% yield on gross assets YTD, or 5.0% net interest
margin net of debt financing
Fees and other income streams, including syndication
fees, sidecar management fees, and other fees from
servicing managed commitments
*MidCap
Financial
70-80 bps budgeted provision for credit losses in a
volatile year with high interest rates
58View entire presentation