Grove Investor Presentation Deck
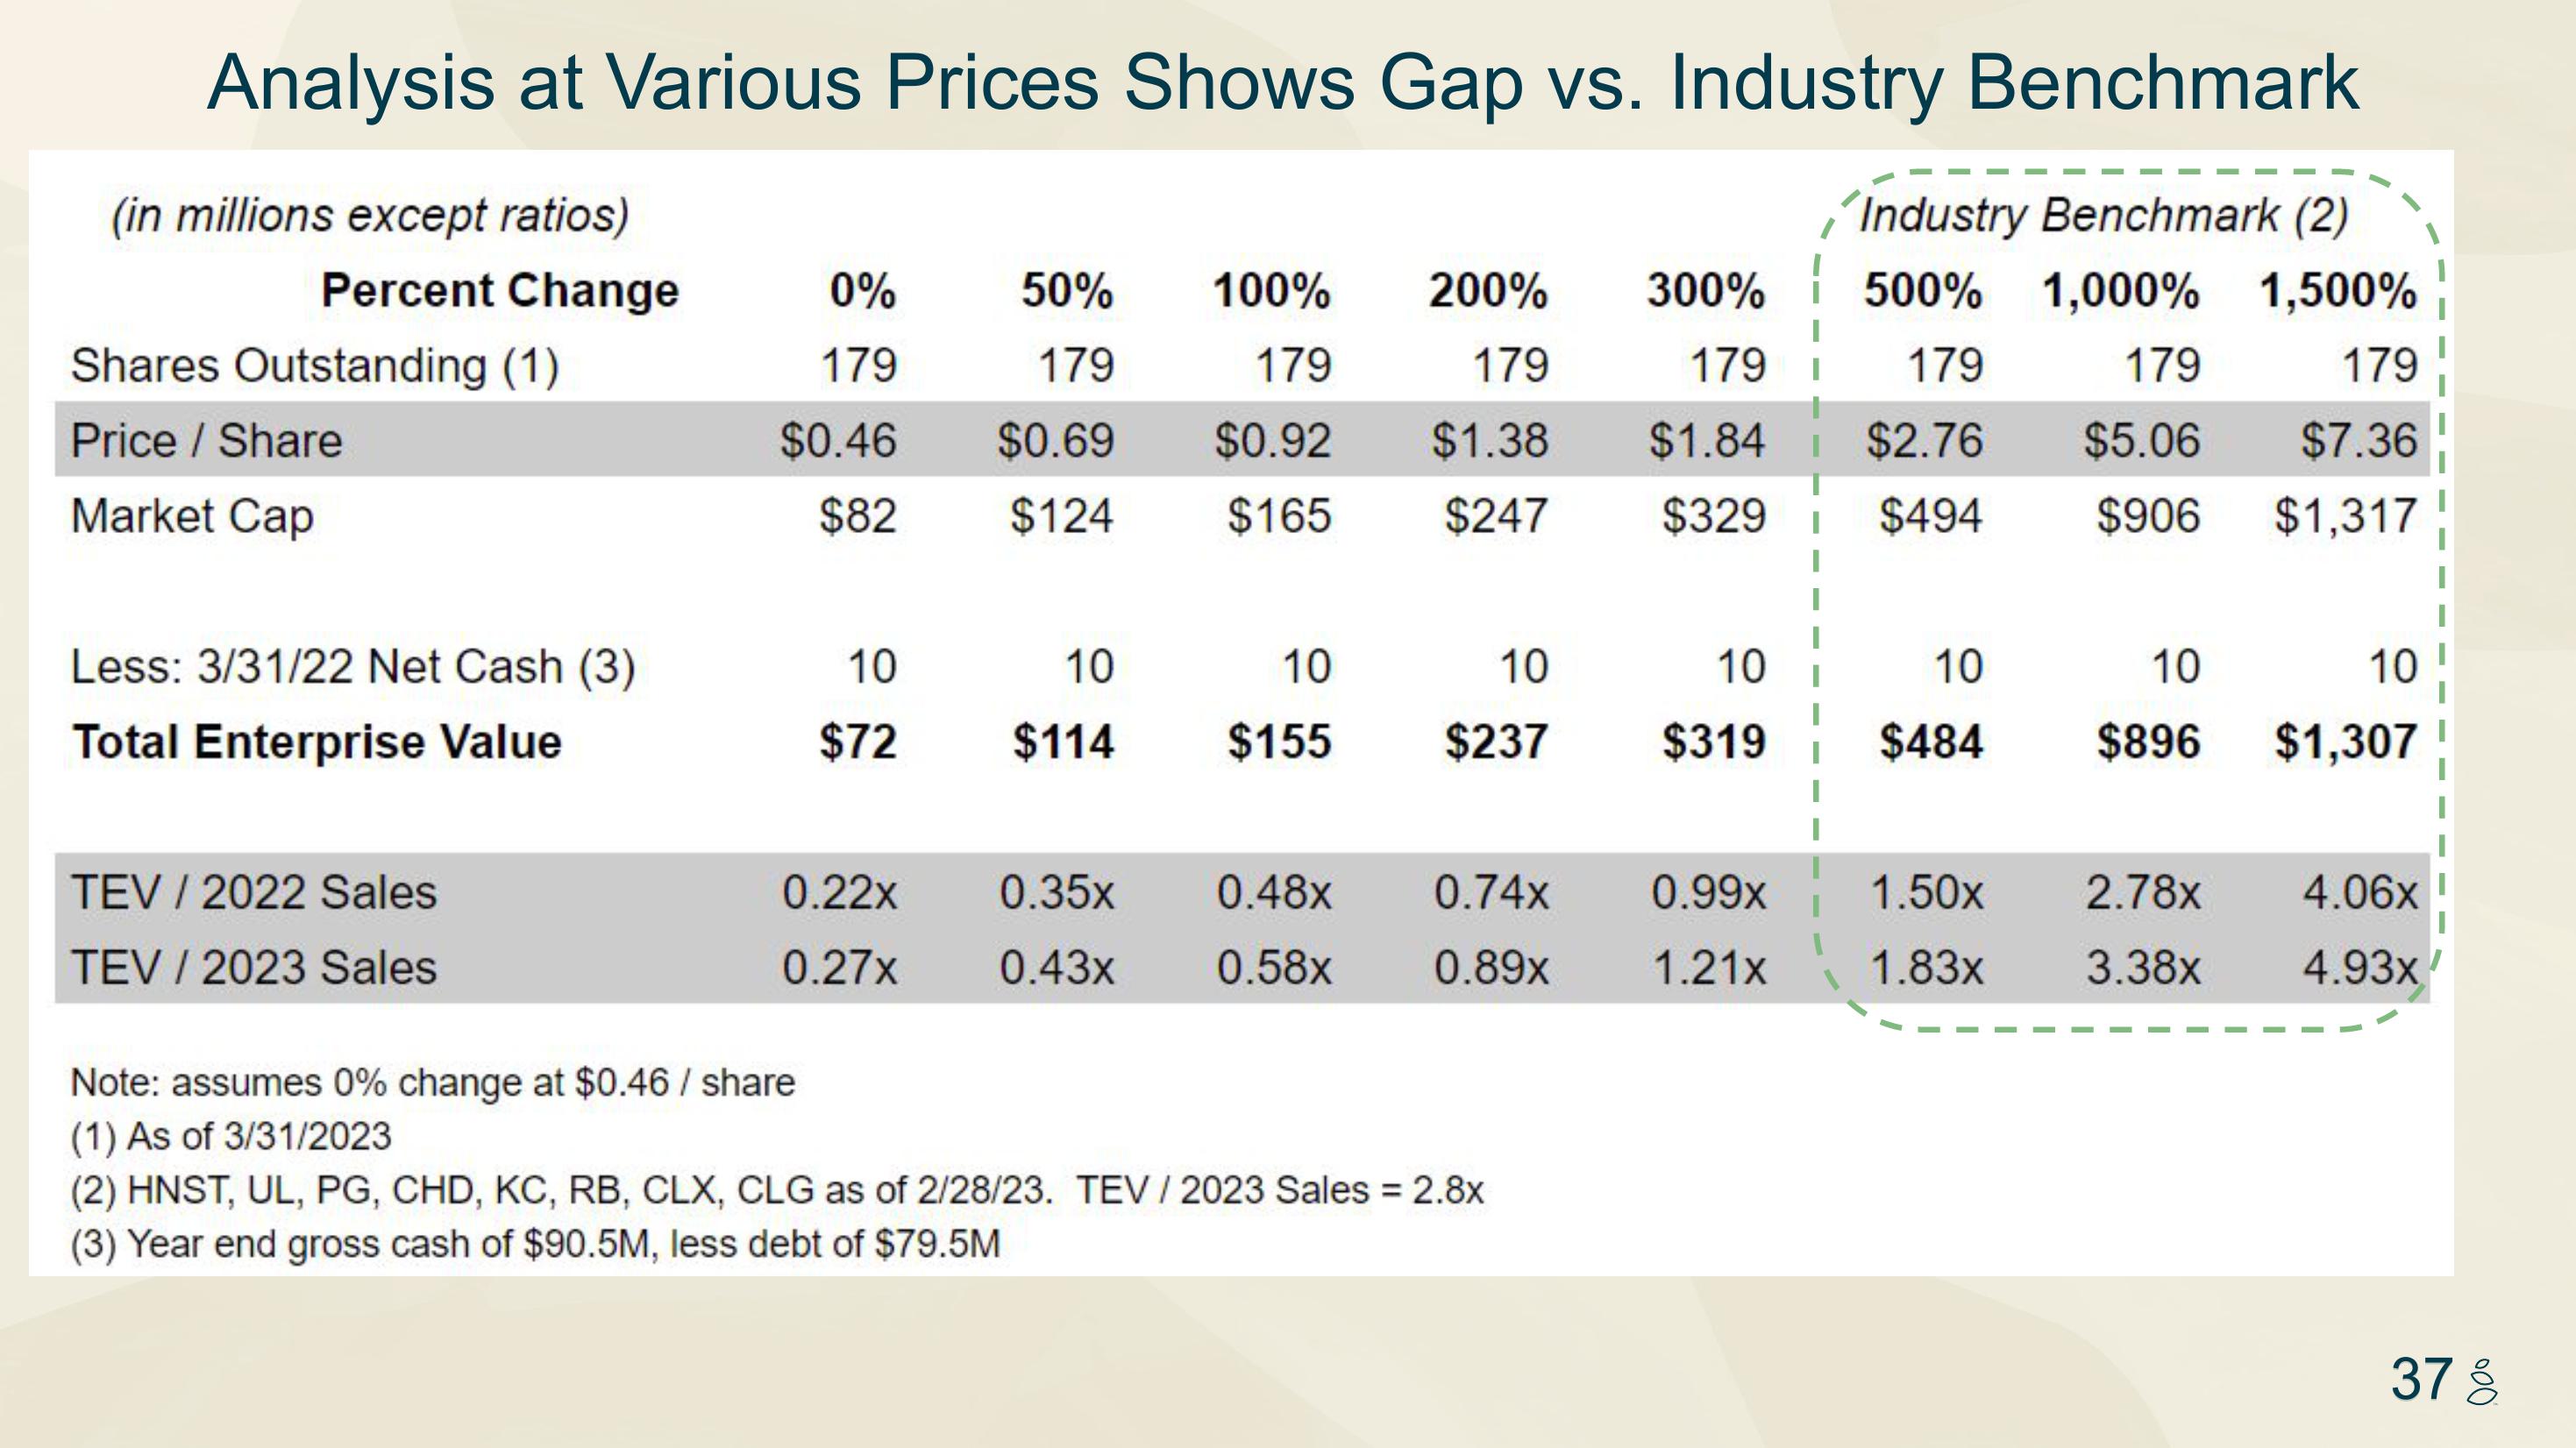
Analysis at Various Prices Shows Gap vs. Industry Benchmark
(in millions except ratios)
Industry Benchmark (2)
Percent Change
Shares Outstanding (1)
Price / Share
Market Cap
Less: 3/31/22 Net Cash (3)
Total Enterprise Value
TEV / 2022 Sales
TEV / 2023 Sales
0%
179
$0.46
$82
10
$72
0.22x
0.27x
50%
179
$0.69
$124
100%
179
179
$0.92 $1.38
$165
$247
200% 300% 500%
179 I
$1.84 $2.76
179
$329
$494
10
10
$114 $155
10
$237
0.35x 0.48x 0.74x
0.43x 0.58x 0.89x
Note: assumes 0% change at $0.46 / share
(1) As of 3/31/2023
(2) HNST, UL, PG, CHD, KC, RB, CLX, CLG as of 2/28/23. TEV/2023 Sales = 2.8x
(3) Year end gross cash of $90.5M, less debt of $79.5M
10
$319 i
0.99x
1.21x
10
$484
1,000% 1,500%
179
$7.36
$1,317
179
$5.06
$906
10
$896
1.50x 2.78x
1.83x
3.38x
10!
$1,307
4.06x
4.93x
378View entire presentation