Zegna Results Presentation Deck
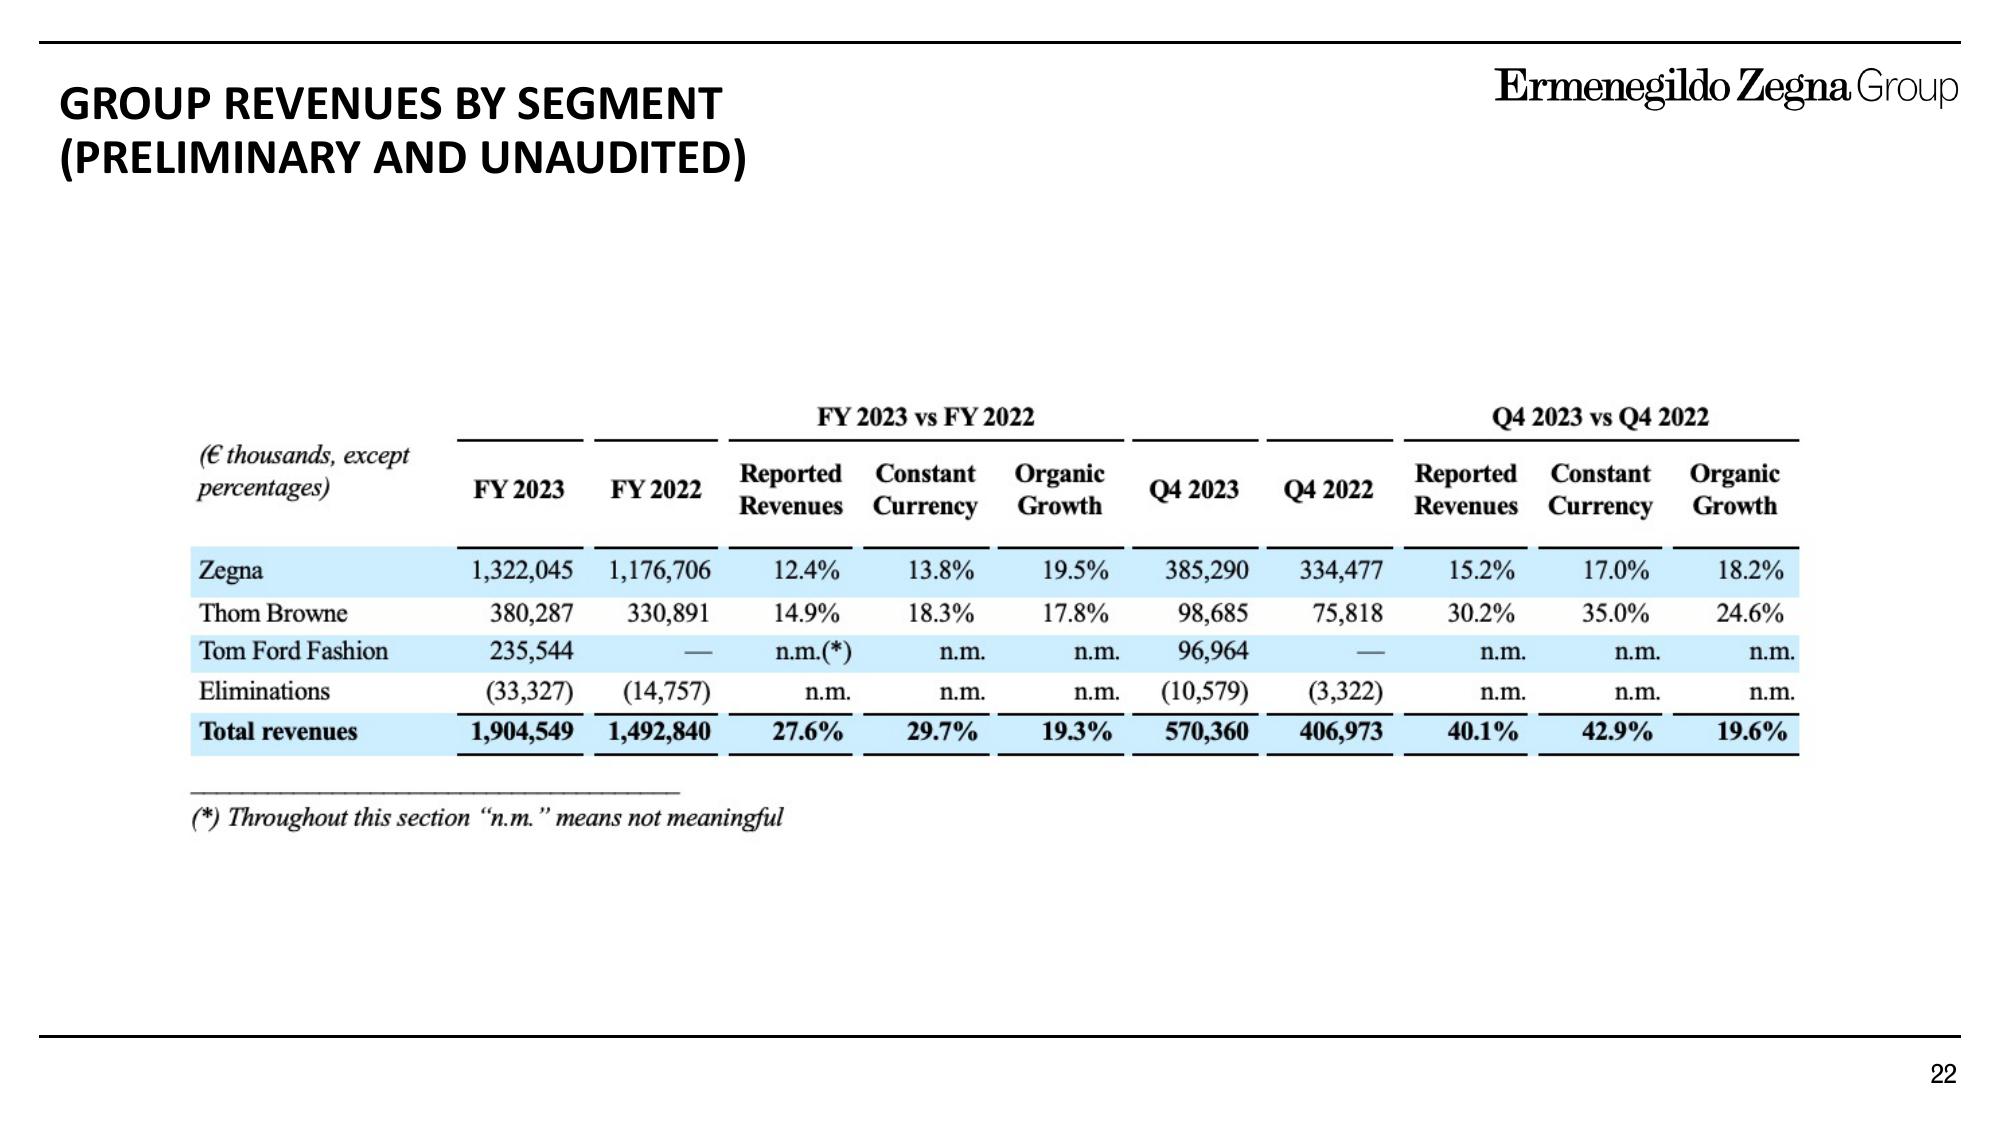
GROUP REVENUES BY SEGMENT
(PRELIMINARY AND UNAUDITED)
(€ thousands, except
percentages)
Zegna
Thom Browne
Tom Ford Fashion
Eliminations
Total revenues
FY 2023 FY 2022
1,322,045 1,176,706
380,287 330,891
235,544
(33,327) (14,757)
1,904,549 1,492,840
FY 2023 vs FY 2022
Reported Constant
Revenues Currency
12.4%
14.9%
n.m.(*)
(*) Throughout this section "n.m." means not meaningful
n.m.
27.6%
13.8%
18.3%
n.m.
n.m.
29.7%
Organic
Growth
19.5%
17.8%
n.m.
Q4 2023
n.m.
Q4 2022
385,290 334,477 15.2%
98,685 75,818 30.2%
96,964
(10,579)
19.3% 570,360
Ermenegildo Zegna Group
Q4 2023 vs Q4 2022
Reported Constant Organic
Revenues Currency Growth
n.m.
(3,322)
406,973 40.1%
n.m.
17.0%
35.0%
n.m.
n.m.
42.9%
18.2%
24.6%
n.m.
n.m.
19.6%
22View entire presentation