Clover Health Investor Day Presentation Deck
Step 3: Improved Decision-Making Yields Enhanced
Outcomes And Unit Economics (Cont'd)
93%
Non-CA
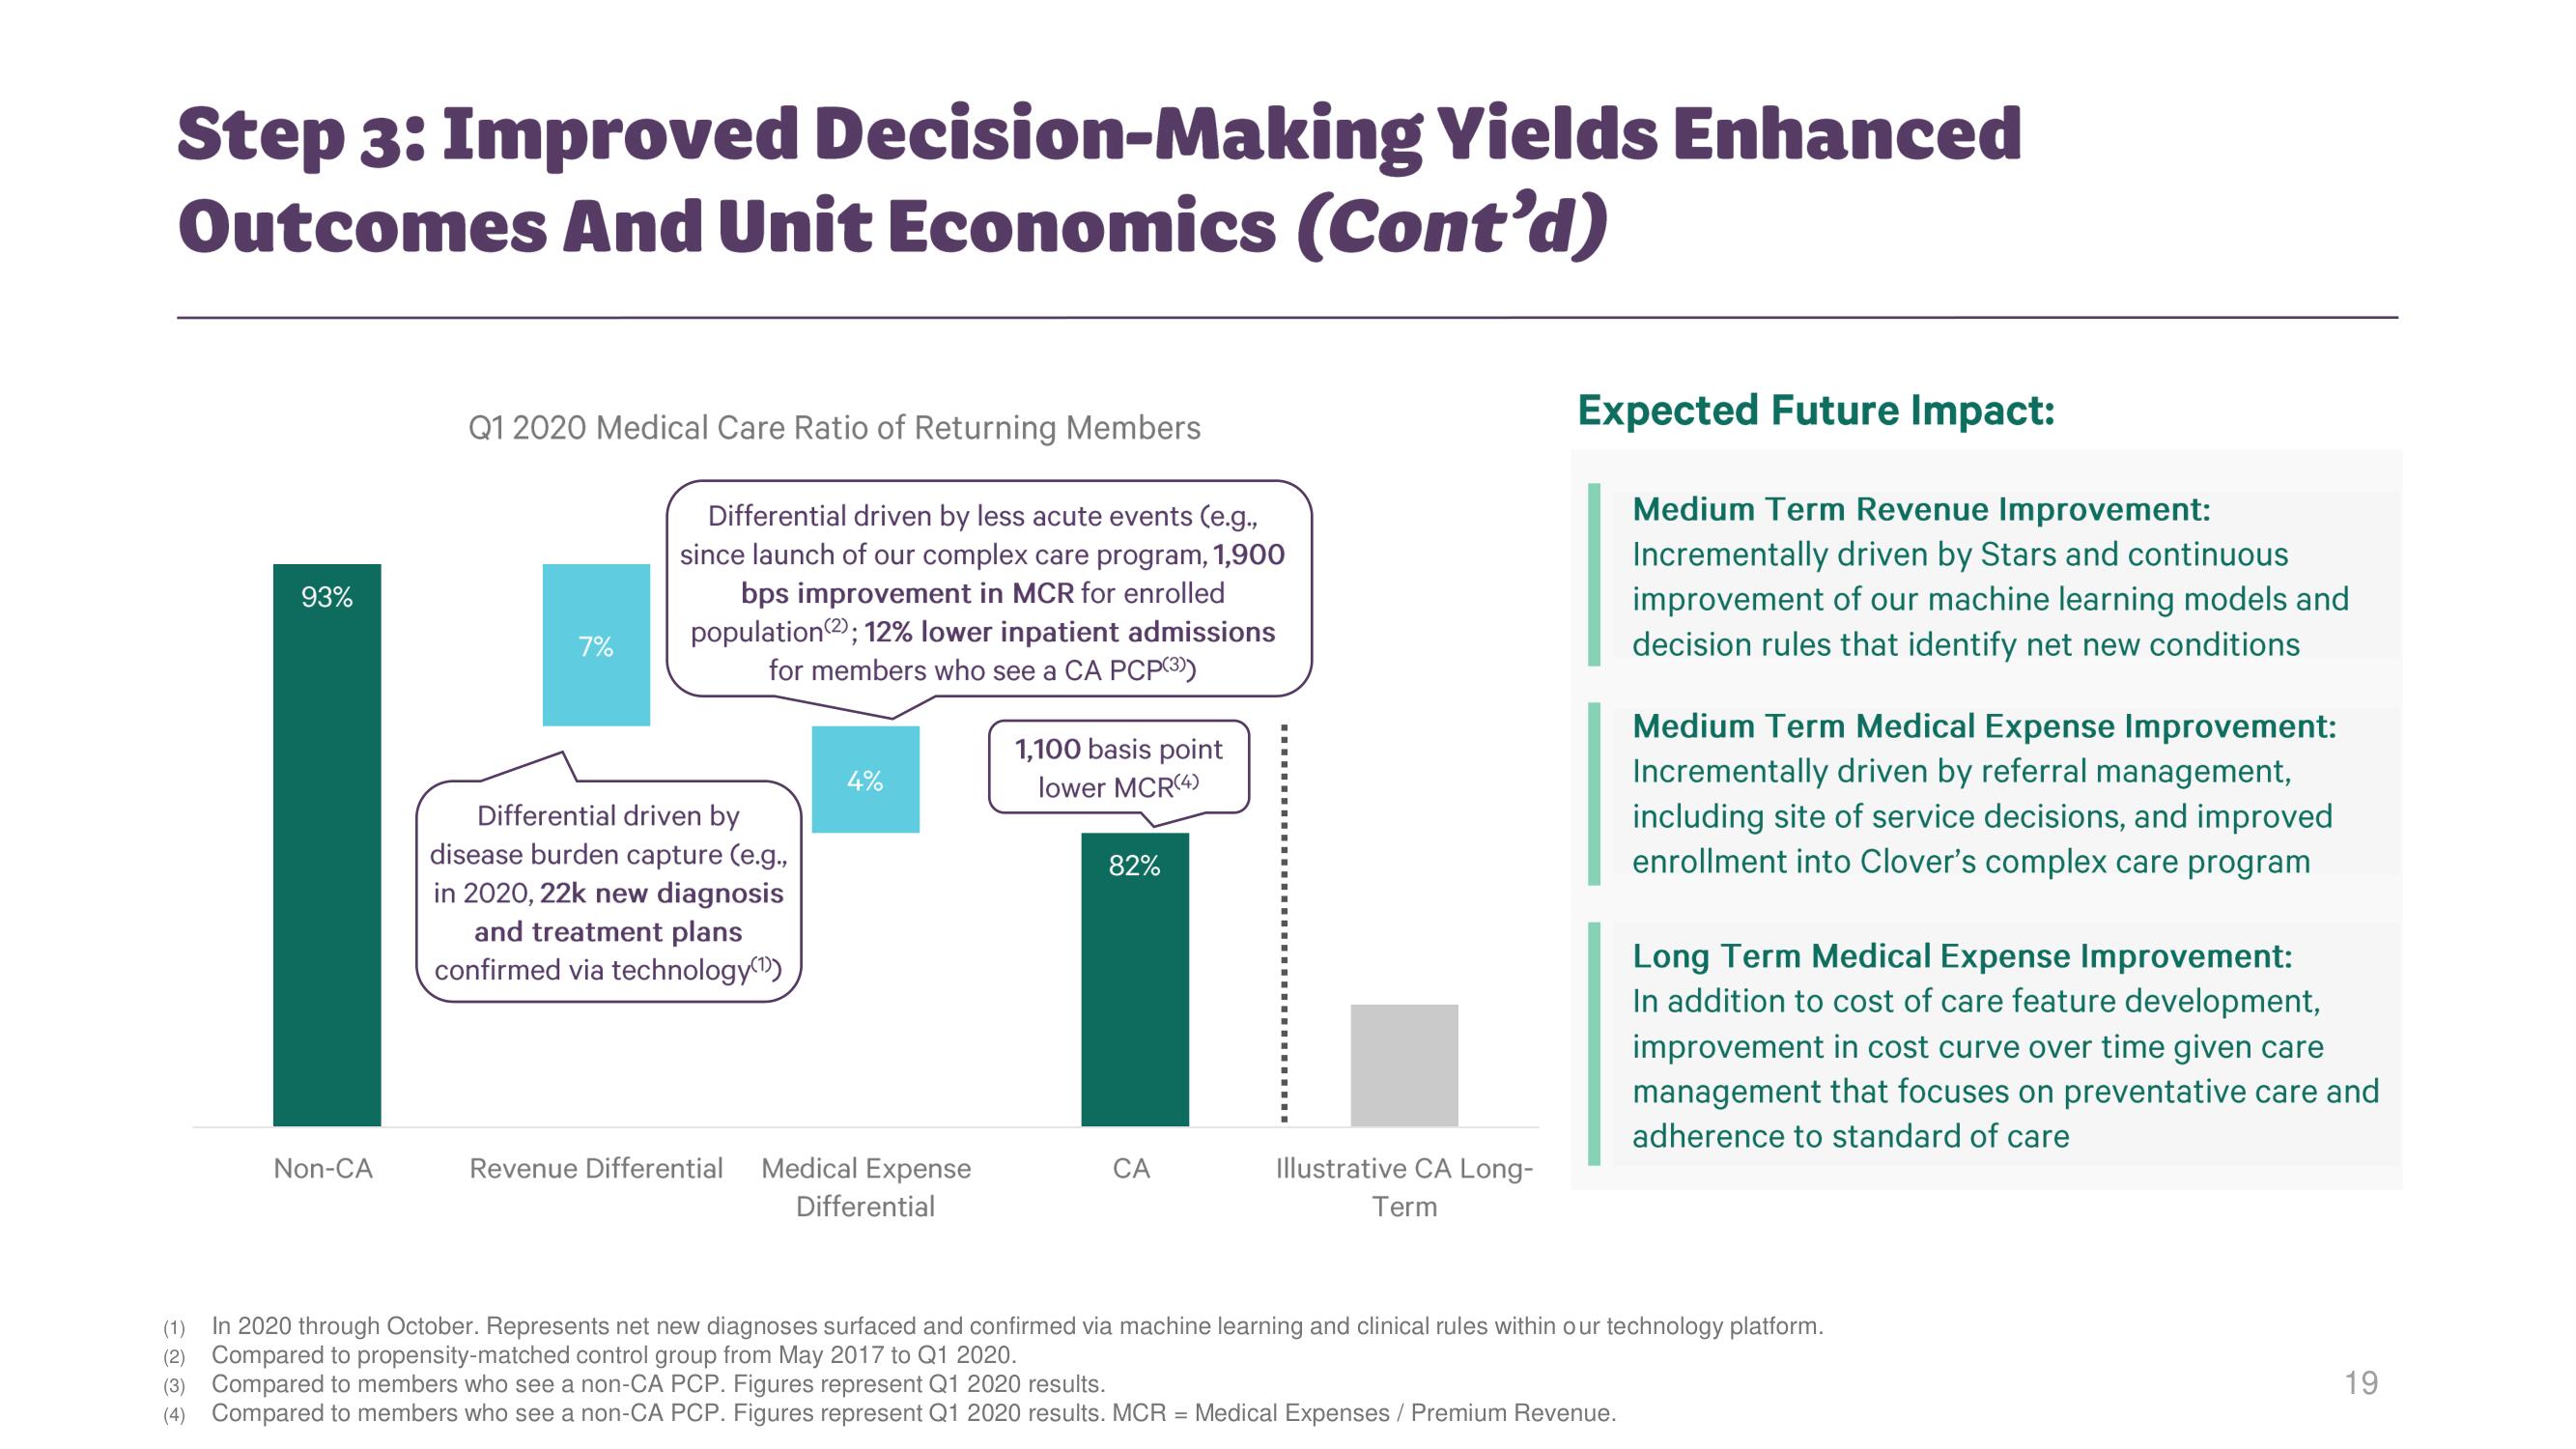
Q1 2020 Medical Care Ratio of Returning Members
7%
Differential driven by less acute events (e.g.,
since launch of our complex care program, 1,900
bps improvement in MCR for enrolled
population (2); 12% lower inpatient admissions
for members who see a CA PCP(3))
Differential driven by
disease burden capture (e.g.,
in 2020, 22k new diagnosis
and treatment plans
confirmed via technology (¹)
4%
Revenue Differential Medical Expense
Differential
1,100 basis point
lower MCR(4)
82%
CA
Illustrative CA Long-
Term
Expected Future Impact:
Medium Term Revenue Improvement:
Incrementally driven by Stars and continuous
improvement of our machine learning models and
decision rules that identify net new conditions
Medium Term Medical Expense Improvement:
Incrementally driven by referral management,
including site of service decisions, and improved
enrollment into Clover's complex care program
Long Term Medical Expense Improvement:
In addition to cost of care feature development,
improvement in cost curve over time given care
management that focuses on preventative care and
adherence to standard of care
(1)
In 2020 through October. Represents net new diagnoses surfaced and confirmed via machine learning and clinical rules within our technology platform.
Compared to propensity-matched control group from May 2017 to Q1 2020.
(2)
(3)
Compared to members who see a non-CA PCP. Figures represent Q1 2020 results.
(4) Compared to members who see a non-CA PCP. Figures represent Q1 2020 results. MCR = Medical Expenses / Premium Revenue.
19View entire presentation