Nikola SPAC Presentation Deck
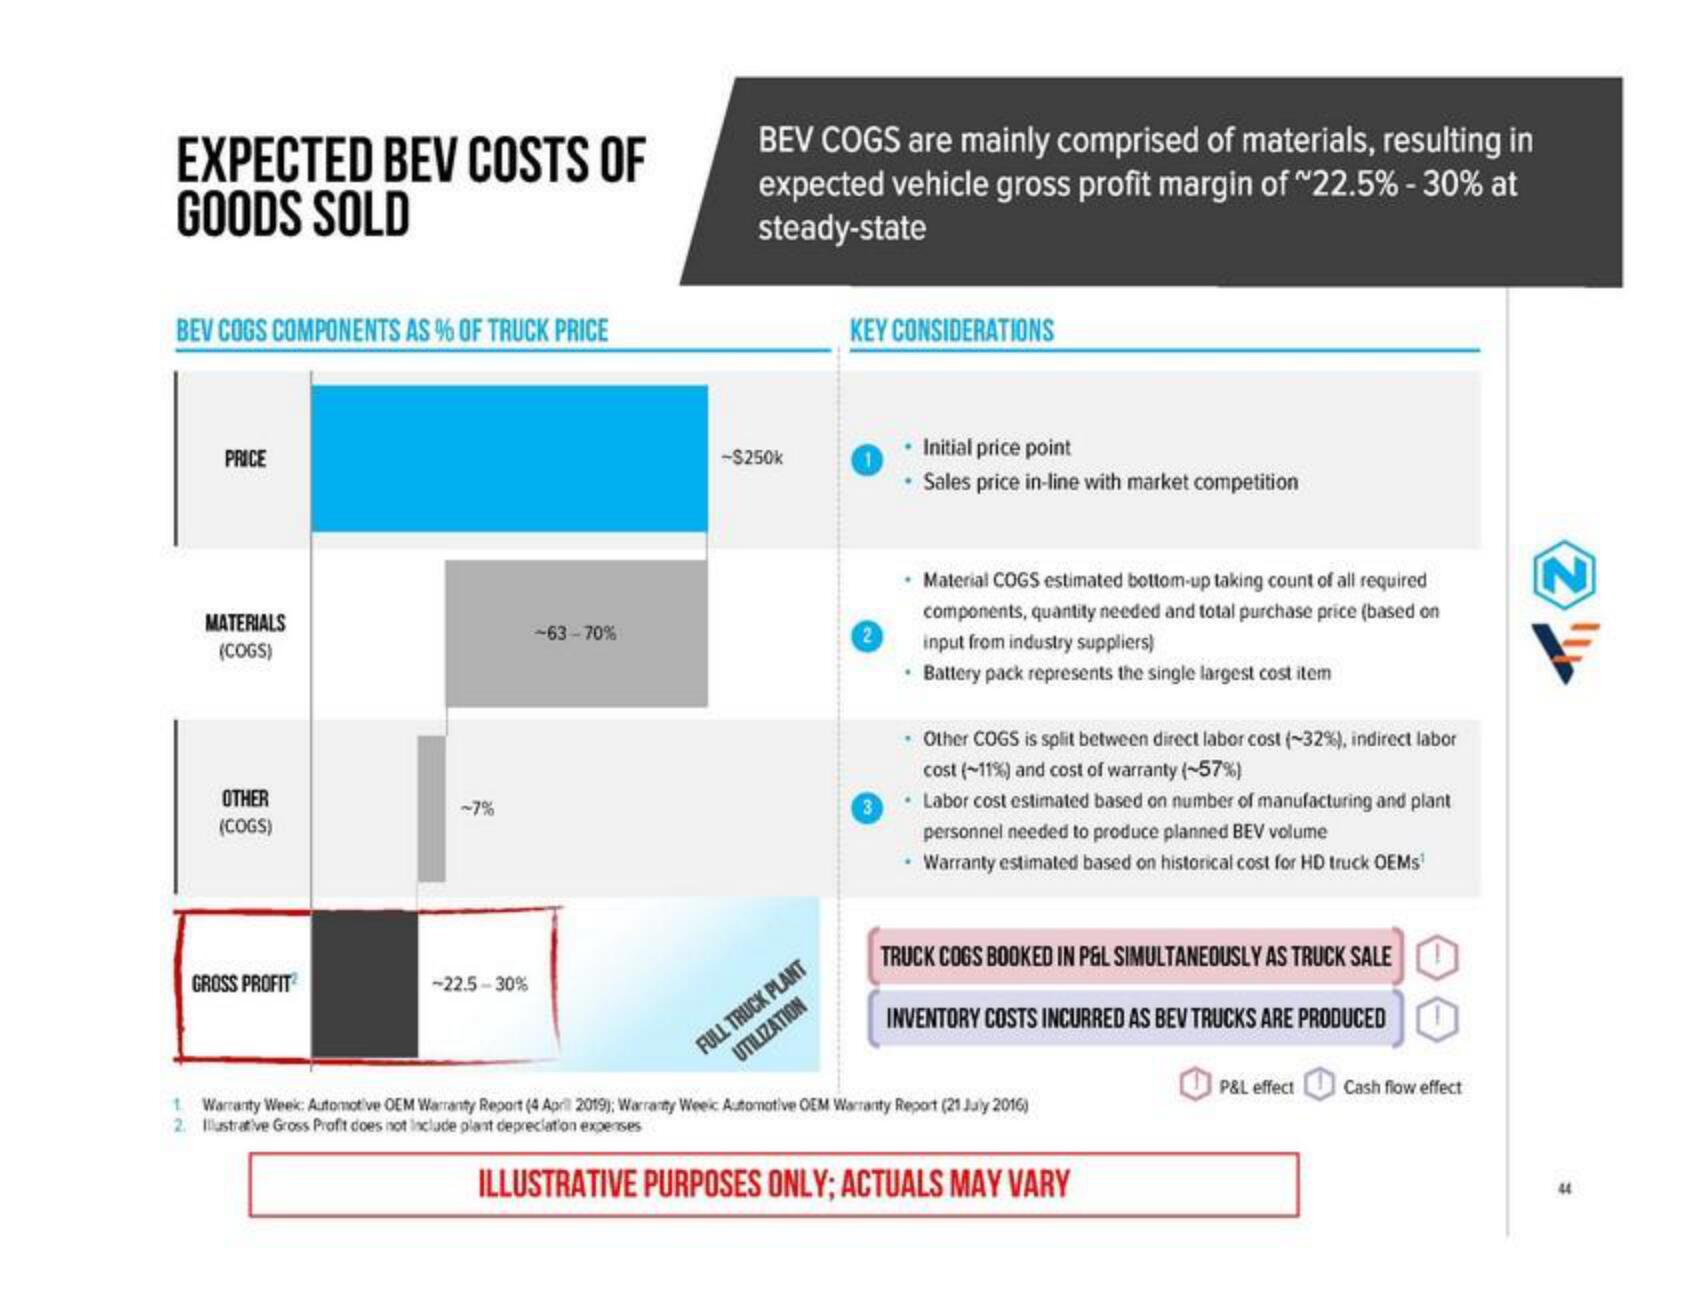
EXPECTED BEV COSTS OF
GOODS SOLD
BEV COGS COMPONENTS AS % OF TRUCK PRICE
PRICE
MATERIALS
(COGS)
OTHER
(COGS)
GROSS PROFIT
-7%
-22.5-30%
-63-70%
BEV COGS are mainly comprised of materials, resulting in
expected vehicle gross profit margin of "22.5% - 30% at
steady-state
-$250k
FULL TRUCK PLANT
UTILIZATION
KEY CONSIDERATIONS
• Initial price point
Sales price in-line with market competition
Material COGS estimated bottom-up taking count of all required
components, quantity needed and total purchase price (based on
input from industry suppliers)
. Battery pack represents the single largest cost item
• Other COGS is split between direct labor cost (~32%), indirect labor
cost (~11%) and cost of warranty (-57%)
3. Labor cost estimated based on number of manufacturing and plant
personnel needed to produce planned BEV volume
• Warranty estimated based on historical cost for HD truck OEMs
TRUCK COGS BOOKED IN P&L SIMULTANEOUSLY AS TRUCK SALE
INVENTORY COSTS INCURRED AS BEV TRUCKS ARE PRODUCED
1. Warranty Week: Automotive OEM Warranty Report (4 April 2019); Warranty Weeic Automotive OEM Warranty Report (21 July 2016)
2. Illustrative Gross Profit does not include plant depreciation expenses
ILLUSTRATIVE PURPOSES ONLY; ACTUALS MAY VARY
P&L effect
Cash flow effect
44View entire presentation