J.P.Morgan Results Presentation Deck
JPMORGAN CHASE & CO.
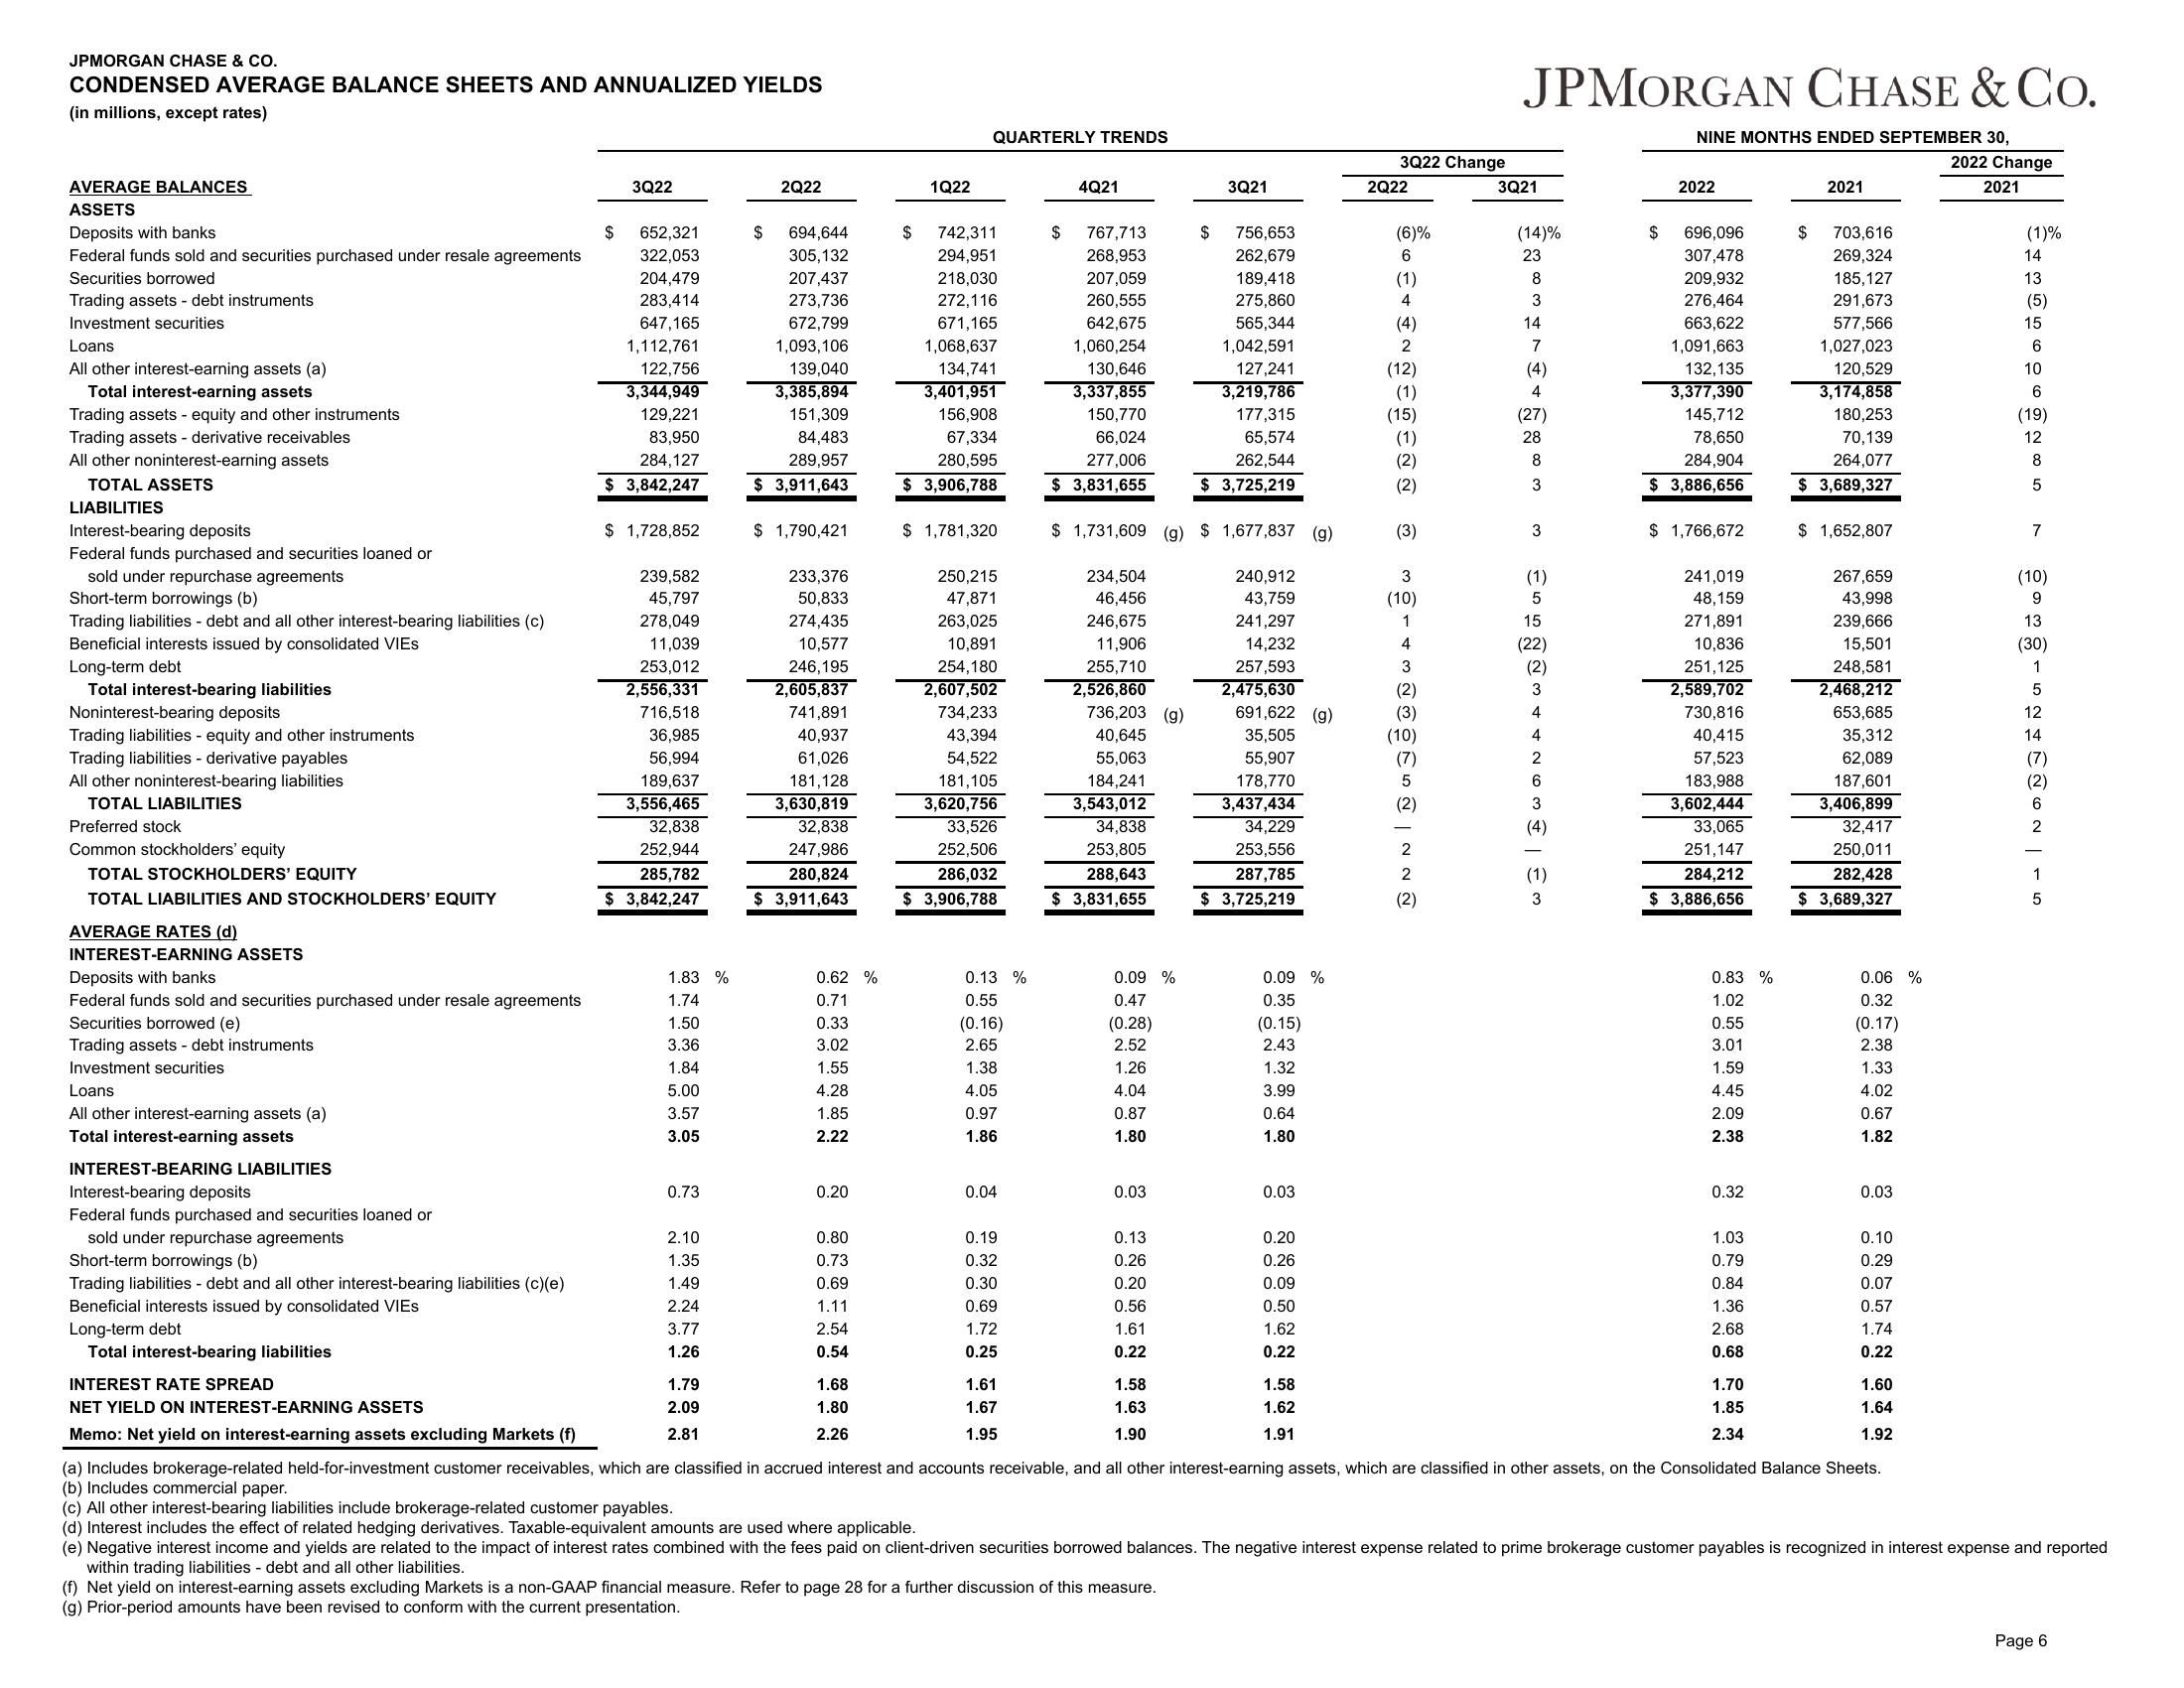
CONDENSED AVERAGE BALANCE SHEETS AND ANNUALIZED YIELDS
(in millions, except rates)
AVERAGE BALANCES
ASSETS
Deposits with banks
Federal funds sold and securities purchased under resale agreements
Securities borrowed
Trading assets - debt instruments
Investment securities
Loans
All other interest-earning assets (a)
Total interest-earning assets
Trading assets - equity and other instruments
Trading assets - derivative receivables
All other noninterest-earning assets
TOTAL ASSETS
LIABILITIES
Interest-bearing deposits
Federal funds purchased and securities loaned or
sold under repurchase agreements
Short-term borrowings (b)
Trading liabilities - debt and all other interest-bearing liabilities (c)
Beneficial interests issued by consolidated VIES
Long-term debt
Total interest-bearing liabilities
Noninterest-bearing deposits
Trading liabilities - equity and other instruments
Trading liabilities - derivative payables
All other noninterest-bearing liabilities
TOTAL LIABILITIES
Preferred stock
Common stockholders' equity
TOTAL STOCKHOLDERS' EQUITY
TOTAL LIABILITIES AND STOCKHOLDERS' EQUITY
AVERAGE RATES (d)
INTEREST-EARNING ASSETS
Deposits with banks
Federal funds sold and securities purchased under resale agreements
Securities borrowed (e)
Trading assets - debt instruments
Investment securities
Loans
All other interest-earning assets (a)
Total interest-earning assets
INTEREST-BEARING LIABILITIES
Interest-bearing deposits
Federal funds purchased and securities loaned or
sold under repurchase agreements
Short-term borrowings (b)
Trading liabilities - debt and all other interest-bearing liabilities (c)(e)
Beneficial interests issued by consolidated VIES
Long-term debt
Total interest-bearing liabilities
INTEREST RATE SPREAD
NET YIELD ON INTEREST-EARNING ASSETS
Memo: Net yield on interest-earning assets excluding Markets (f)
$
3Q22
652,321
322,053
204,479
283,414
647,165
1,112,761
122,756
3,344,949
129,221
83,950
284,127
$ 3,842,247
$ 1,728,852
239,582
45,797
278,049
11,039
253,012
2,556,331
716,518
36,985
56,994
189,637
3,556,465
32,838
252,944
285,782
$ 3,842,247
1.83 %
1.74
1.50
3.36
1.84
5.00
3.57
3.05
0.73
2.10
1.35
1.49
2.24
3.77
1.26
1.79
2.09
2.81
$
2Q22
694,644
305,132
207,437
273,736
672,799
1,093,106
139,040
3,385,894
151,309
84,483
289,957
$ 3,911,643
$ 1,790,421
233,376
50,833
274,435
10,577
246,195
2,605,837
741,891
40,937
61,026
181,128
3,630,819
32,838
247,986
280,824
$ 3,911,643
0.62 %
0.71
0.33
3.02
1.55
4.28
1.85
2.22
0.20
0.80
0.73
0.69
1.11
2.54
0.54
1.68
1.80
2.26
1Q22
$
QUARTERLY TRENDS
742,311
294,951
218,030
272,116
671,165
1,068,637
134,741
3,401,951
156,908
67,334
280,595
$ 3,906,788
$ 1,781,320
250,215
47,871
263,025
10,891
254,180
2,607,502
734,233
43,394
54,522
181,105
3,620,756
33,526
252,506
286,032
$ 3,906,788
0.13%
0.55
(0.16)
2.65
1.38
4.05
0.97
1.86
0.04
0.19
0.32
0.30
0.69
1.72
0.25
1.61
1.67
1.95
4Q21
$
767,713
268,953
207,059
260,555
642,675
1,060,254
130,646
3,337,855
150,770
66,024
277,006
$ 3,831,655
736,203 (g)
40,645
55,063
184,241
3,543,012
34,838
253,805
288,643
$ 3,831,655
0.09 %
0.47
$ 1,731,609 (g) $ 1,677,837 (g)
234,504
46,456
246,675
240,912
43,759
241,297
14,232
257,593
2,475,630
11,906
255,710
2,526,860
(0.28)
2.52
1.26
4.04
0.87
1.80
0.03
0.13
0.26
0.20
0.56
1.61
0.22
1.58
1.63
1.90
3Q21
$
756,653
262,679
189,418
275,860
565,344
1,042,591
127,241
3,219,786
177,315
65,574
262,544
$ 3,725,219
691,622 (g)
35,505
55,907
178,770
3,437,434
34,229
253,556
287,785
$ 3,725,219
0.09 %
0.35
(0.15)
2.43
1.32
3.99
0.64
1.80
0.03
0.20
0.26
0.09
0.50
1.62
0.22
1.58
1.62
1.91
3Q22 Change
2Q22
(6)%
6
(1)
4
* -ENN
(4)
(12)
(1)
(15)
(2)
(2)
(3)
(10)
(2)
(10)
(2)
(2)
JPMORGAN CHASE & CO.
NINE MONTHS ENDED SEPTEMBER 30,
3Q21
(14)%
23
8
3
14
7
(4)
4
(27)
28
8
3
3
WEIE WONA AWNN GGE
(22)
$
2022
696,096
307,478
209,932
276,464
663,622
1,091,663
132,135
3,377,390
145,712
78,650
284,904
$ 3,886,656
$ 1,766,672
241,019
48,159
271,891
10,836
251,125
2,589,702
730,816
40,415
57,523
183,988
3,602,444
33,065
251,147
284,212
$ 3,886,656
0.83 %
1.02
0.55
3.01
1.59
4.45
2.09
2.38
0.32
1.03
0.79
0.84
1.36
2.68
0.68
1.70
1.85
2.34
$
2021
703,616
269,324
185,127
291,673
577,566
1,027,023
120,529
3,174,858
180,253
70,139
264,077
$ 3,689,327
$1,652,807
267,659
43,998
239,666
15,501
248,581
2,468,212
653,685
35,312
62,089
187,601
3,406,899
32,417
250,011
282,428
$ 3,689,327
0.06 %
0.32
(0.17)
2.38
1.33
4.02
0.67
1.82
0.03
0.10
0.29
0.07
0.57
1.74
0.22
1.60
1.64
1.92
(a) Includes brokerage-related held-for-investment customer receivables, which are classified in accrued interest and accounts receivable, and all other interest-earning assets, which are classified in other assets, on the Consolidated Balance Sheets.
(b) Includes commercial paper.
2022 Change
2021
(1)%
០៣ លឺ ១៩ ១ ហិ ច ៨
(19)
7
(10)
(30)
G| NONANG-
(c) All other interest-bearing liabilities include brokerage-related customer payables.
(d) Interest includes the effect of related hedging derivatives. Taxable-equivalent amounts are used where applicable.
(e) Negative interest income and yields are related to the impact of interest rates combined with the fees paid on client-driven securities borrowed balances. The negative interest expense related to prime brokerage customer payables is recognized in interest expense and reported
within trading liabilities - debt and all other liabilities.
(f) Net yield on interest-earning assets excluding Markets is a non-GAAP financial measure. Refer to page 28 for a further discussion of this measure.
(g) Prior-period amounts have been revised to conform with the current presentation.
Page 6View entire presentation