Confluent Results Presentation Deck
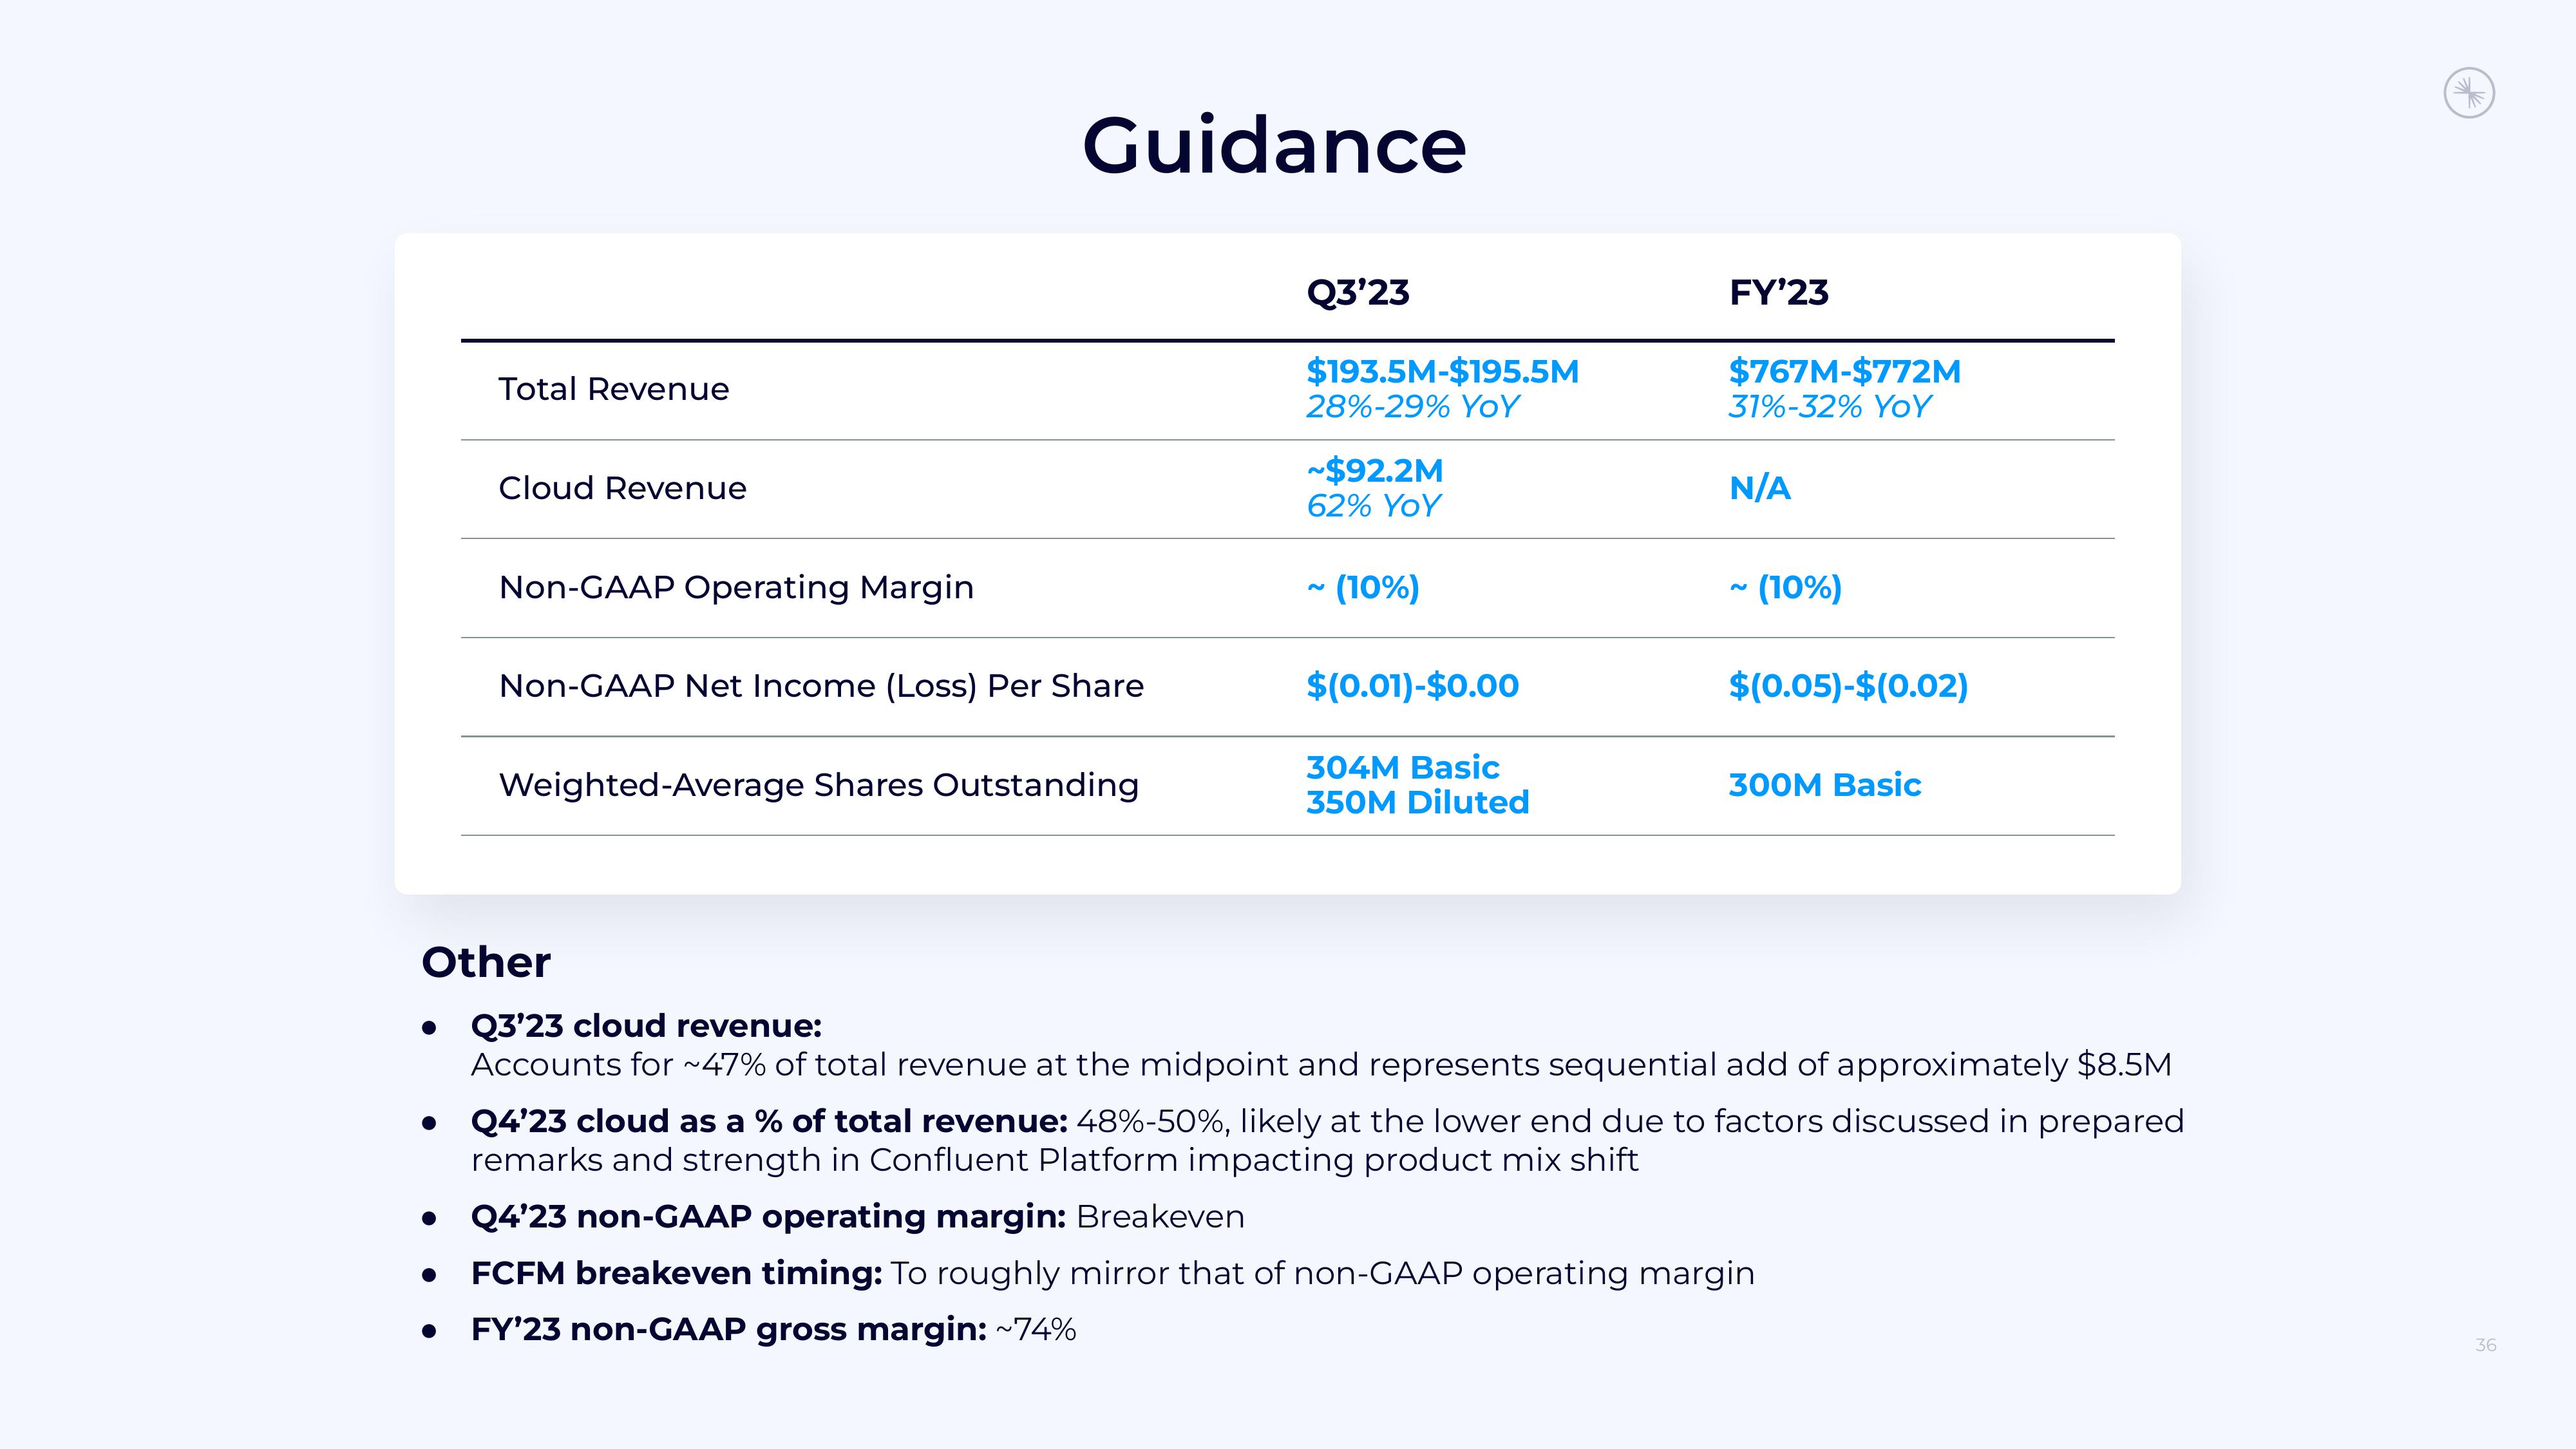
Total Revenue
Cloud Revenue
Non-GAAP Operating Margin
Guidance
Non-GAAP Net Income (Loss) Per Share
Weighted-Average Shares Outstanding
Q3'23
$193.5M-$195.5M
28%-29% YoY
~$92.2M
62% YOY
~ (10%)
$(0.01)-$0.00
304M Basic
350M Diluted
FY'23
$767M-$772M
31%-32% YoY
N/A
~ (10%)
$(0.05)-$(0.02)
300M Basic
Other
• Q3'23 cloud revenue:
Accounts for ~47% of total revenue at the midpoint and represents sequential add of approximately $8.5M
• Q4'23 cloud as a % of total revenue: 48%-50%, likely at the lower end due to factors discussed in prepared
remarks and strength in Confluent Platform impacting product mix shift
• Q4'23 non-GAAP operating margin: Breakeven
● FCFM breakeven timing: To roughly mirror that of non-GAAP operating margin
FY'23 non-GAAP gross margin: ~74%
36View entire presentation