LCI Industries Investor Presentation Deck slide image

LCI Industries Investor Presentation Deck

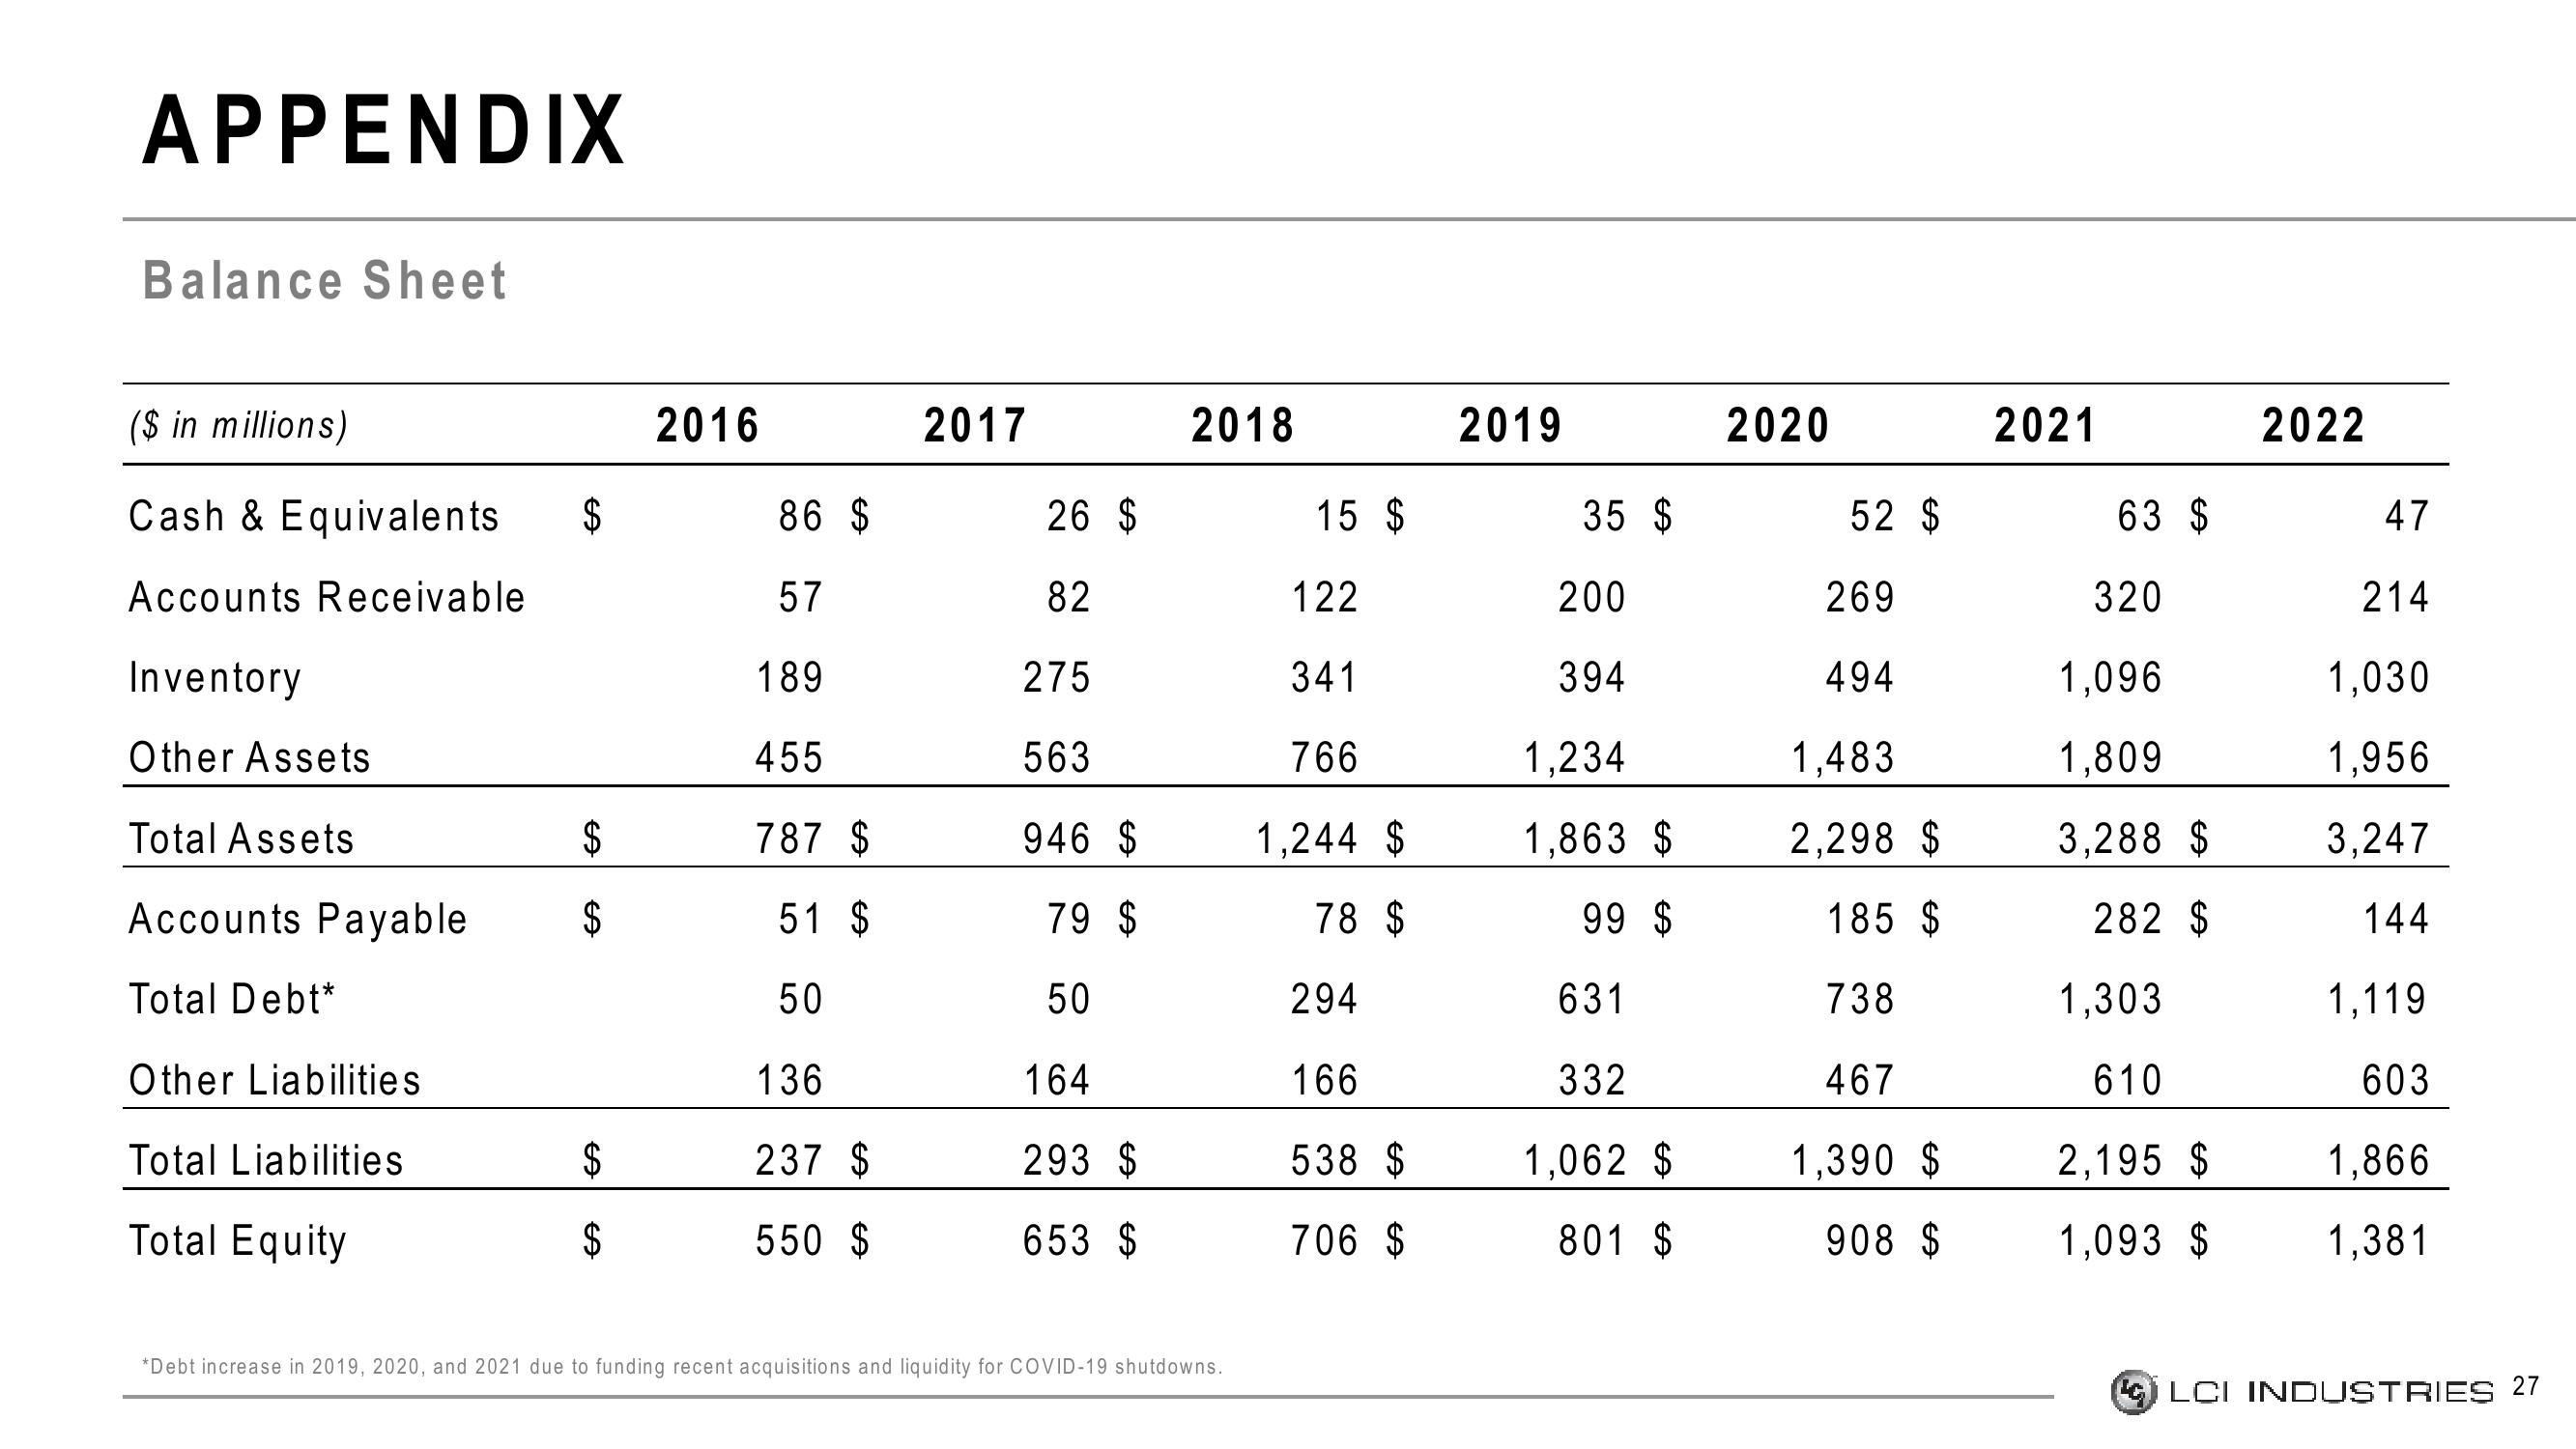
APPENDIX Balance Sheet ($ in millions) Cash & Equivalents $ Accounts Receivable Inventory Other Assets Total Assets Accounts Payable Total Debt* Other Liabilities Total Liabilities Total Equity $ $ SA $ $ 2016 86 $ 57 189 455 787 $ 51 $ 50 136 237 $ 550 $ 2017 26 $ 82 275 563 946 $ 79 $ 50 164 293 $ 653 $ 2018 *Debt increase in 2019, 2020, and 2021 due to funding recent acquisitions and liquidity for COVID-19 shutdowns. 15 $ 122 341 766 1,244 $ 78 $ 294 166 538 $ 706 $ 2019 35 $ 200 394 1,234 1,863 $ 99 $ 631 332 1,062 $ 801 $ 2020 52 $ 269 494 1,483 2,298 $ 185 $ 738 467 1,390 $ 908 $ 2021 63 $ 320 1,096 1,809 3,288 $ 282 $ 1,303 610 2,195 $ 1,093 $ 2022 47 214 1,030 1,956 3,247 144 1,119 603 1,866 1,381 LCI INDUSTRIES 27
View entire presentation