Embracer Group Results Presentation Deck
FINANCIAL PERFORMANCE Q4
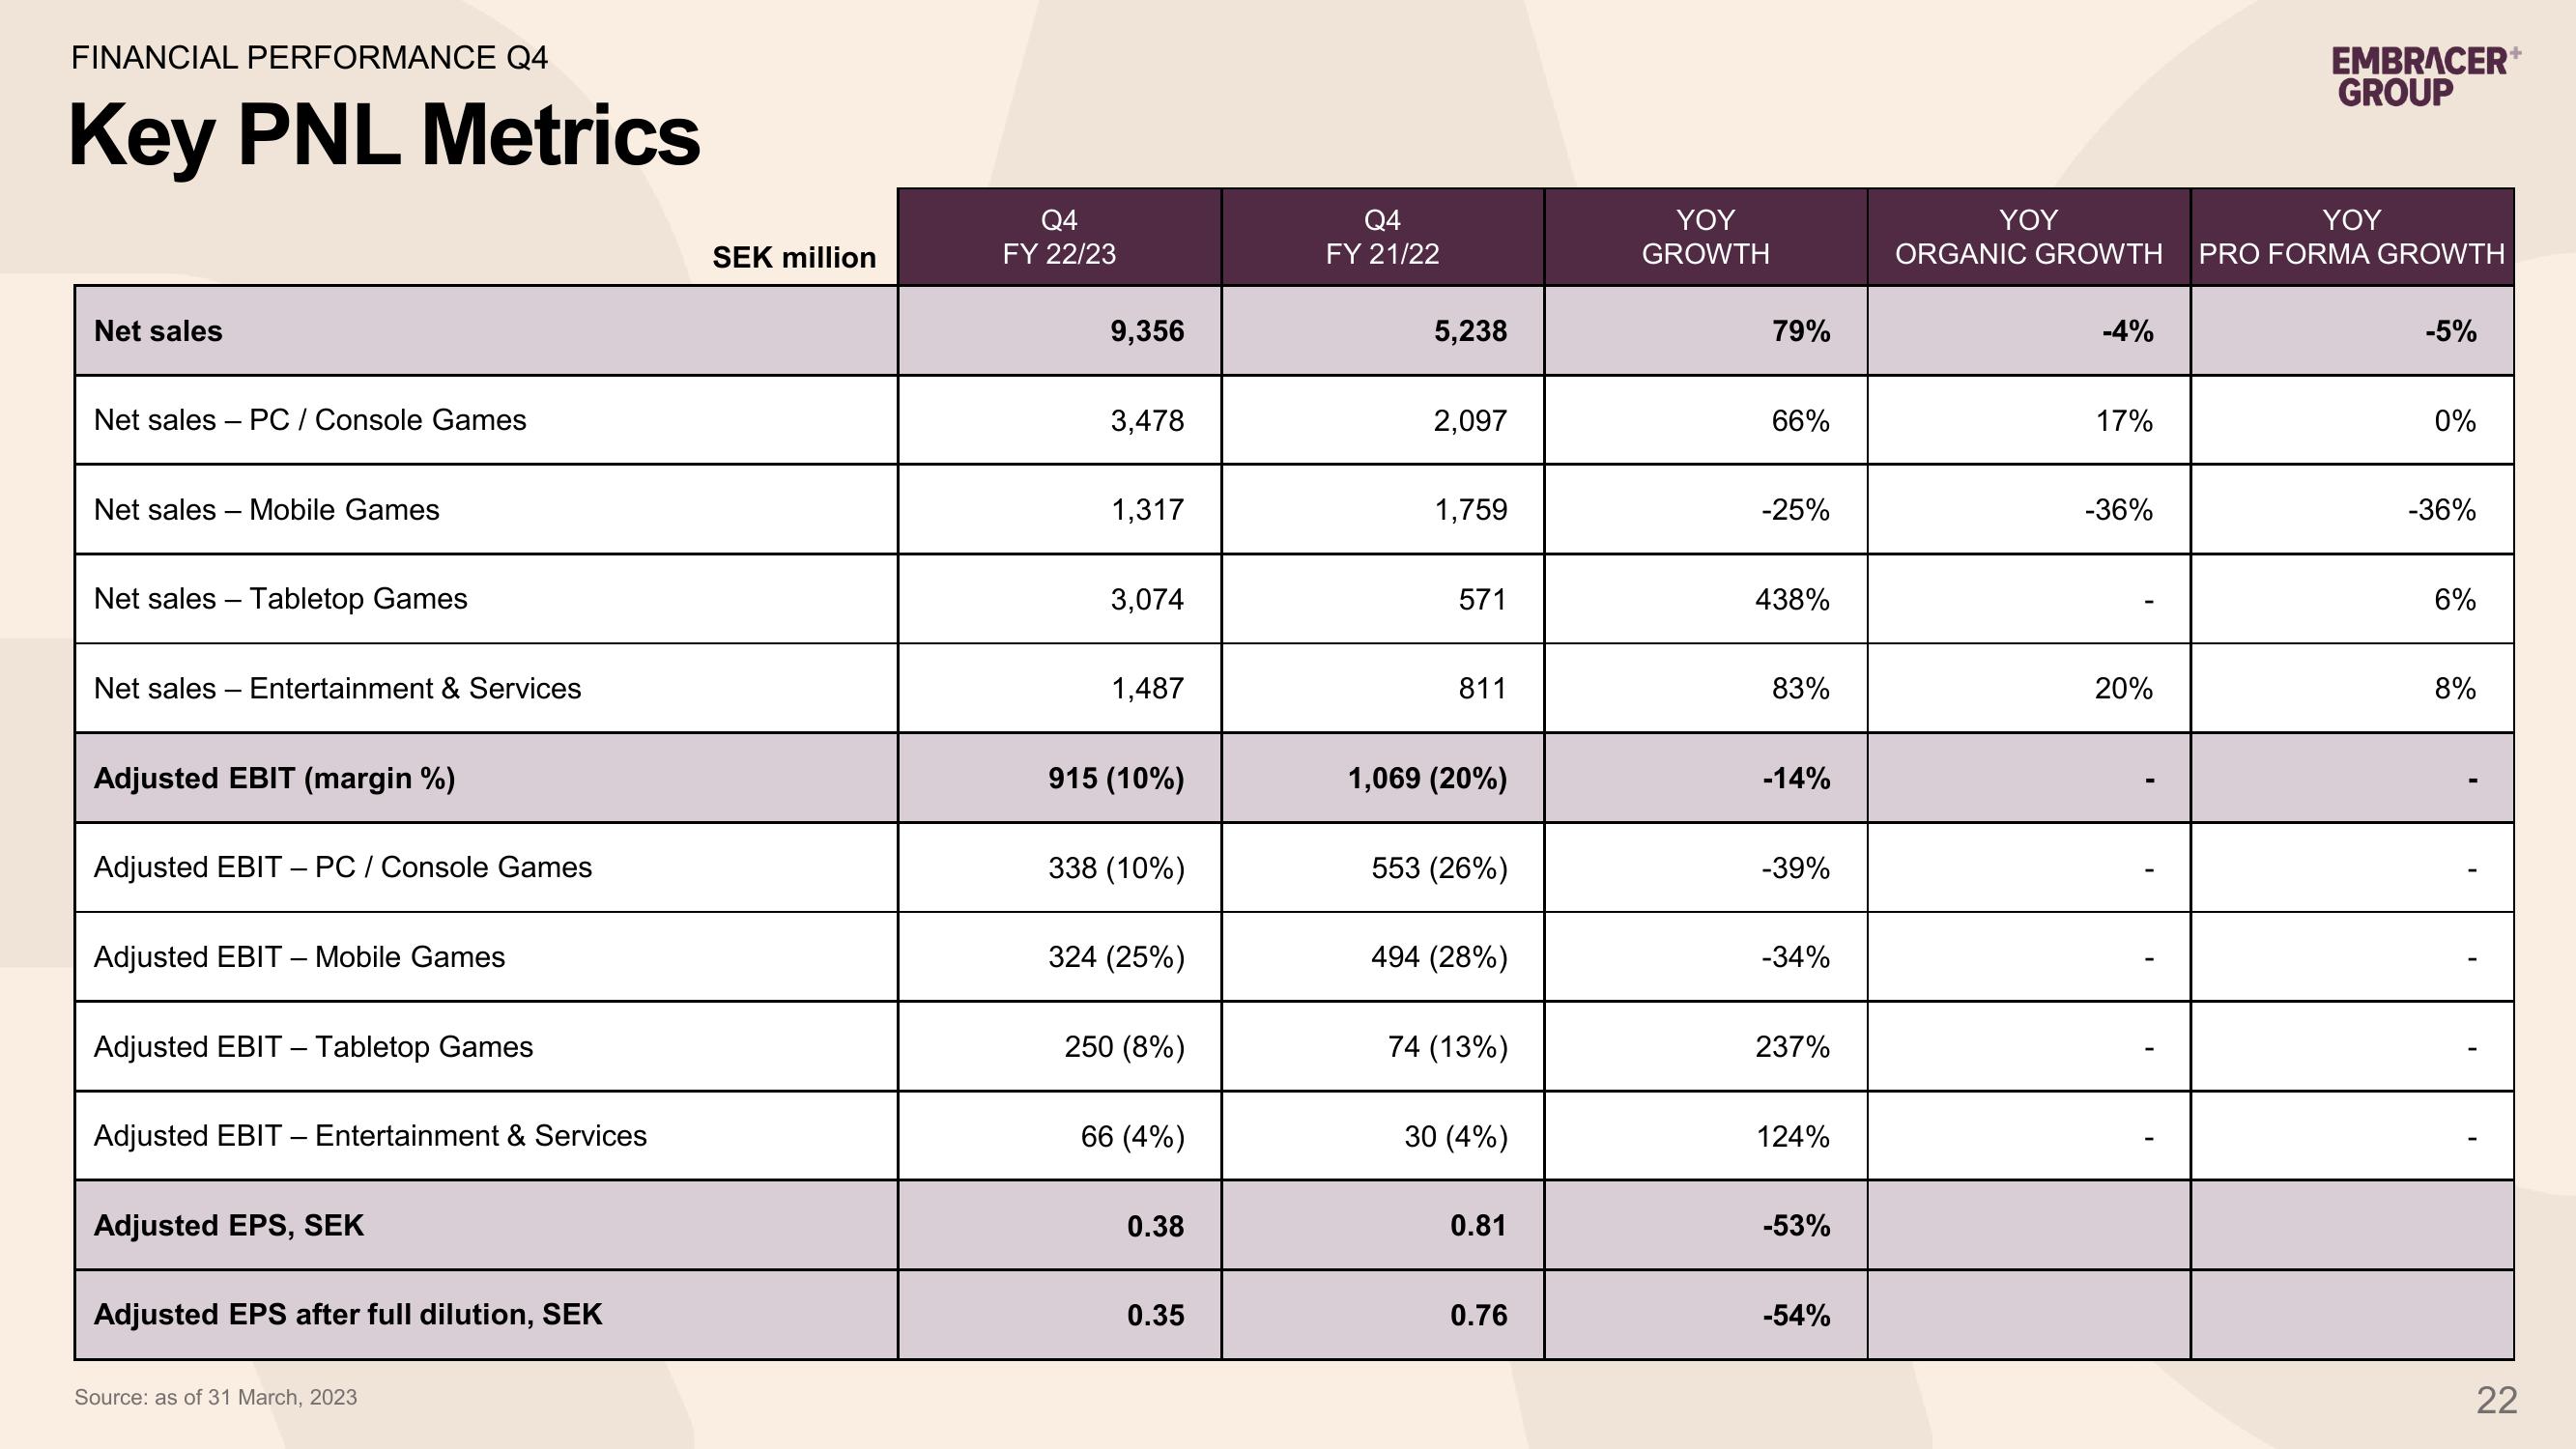
Key PNL Metrics
Net sales
Net sales - PC / Console Games
Net sales - Mobile Games
Net sales - Tabletop Games
Net sales - Entertainment & Services
Adjusted EBIT (margin %)
Adjusted EBIT - PC/Console Games
Adjusted EBIT - Mobile Games
Adjusted EBIT - Tabletop Games
Adjusted EBIT - Entertainment & Services
Adjusted EPS, SEK
Adjusted EPS after full dilution, SEK
Source: as of 31 March, 2023
SEK million
Q4
FY 22/23
9,356
3,478
1,317
3,074
1,487
915 (10%)
338 (10%)
324 (25%)
250 (8%)
66 (4%)
0.38
0.35
Q4
FY 21/22
5,238
2,097
1,759
571
811
1,069 (20%)
553 (26%)
494 (28%)
74 (13%)
30 (4%)
0.81
0.76
YOY
GROWTH
79%
66%
-25%
438%
83%
-14%
-39%
-34%
237%
124%
-53%
-54%
YOY
YOY
ORGANIC GROWTH PRO FORMA GROWTH
-4%
17%
-36%
EMBRACER+
GROUP
20%
-5%
0%
-36%
6%
8%
22View entire presentation