First Merchants Results Presentation Deck
Noninterest Expense Highlights
4Q23 Noninterest Expense Detail
Outside Data Processing
$5.9
6%
Premises & Equipment
$15.2
14%
$108.1M
Total
Salary & Benefits
$60.9
56%
Professional & Other Outside Services
$4.0
4%
FDIC Expense
$7.6
7%
Other
$9.7
9%
Intangible Asset Amortization
$2.2
2%
Marketing
$2.6
2%
Highlights
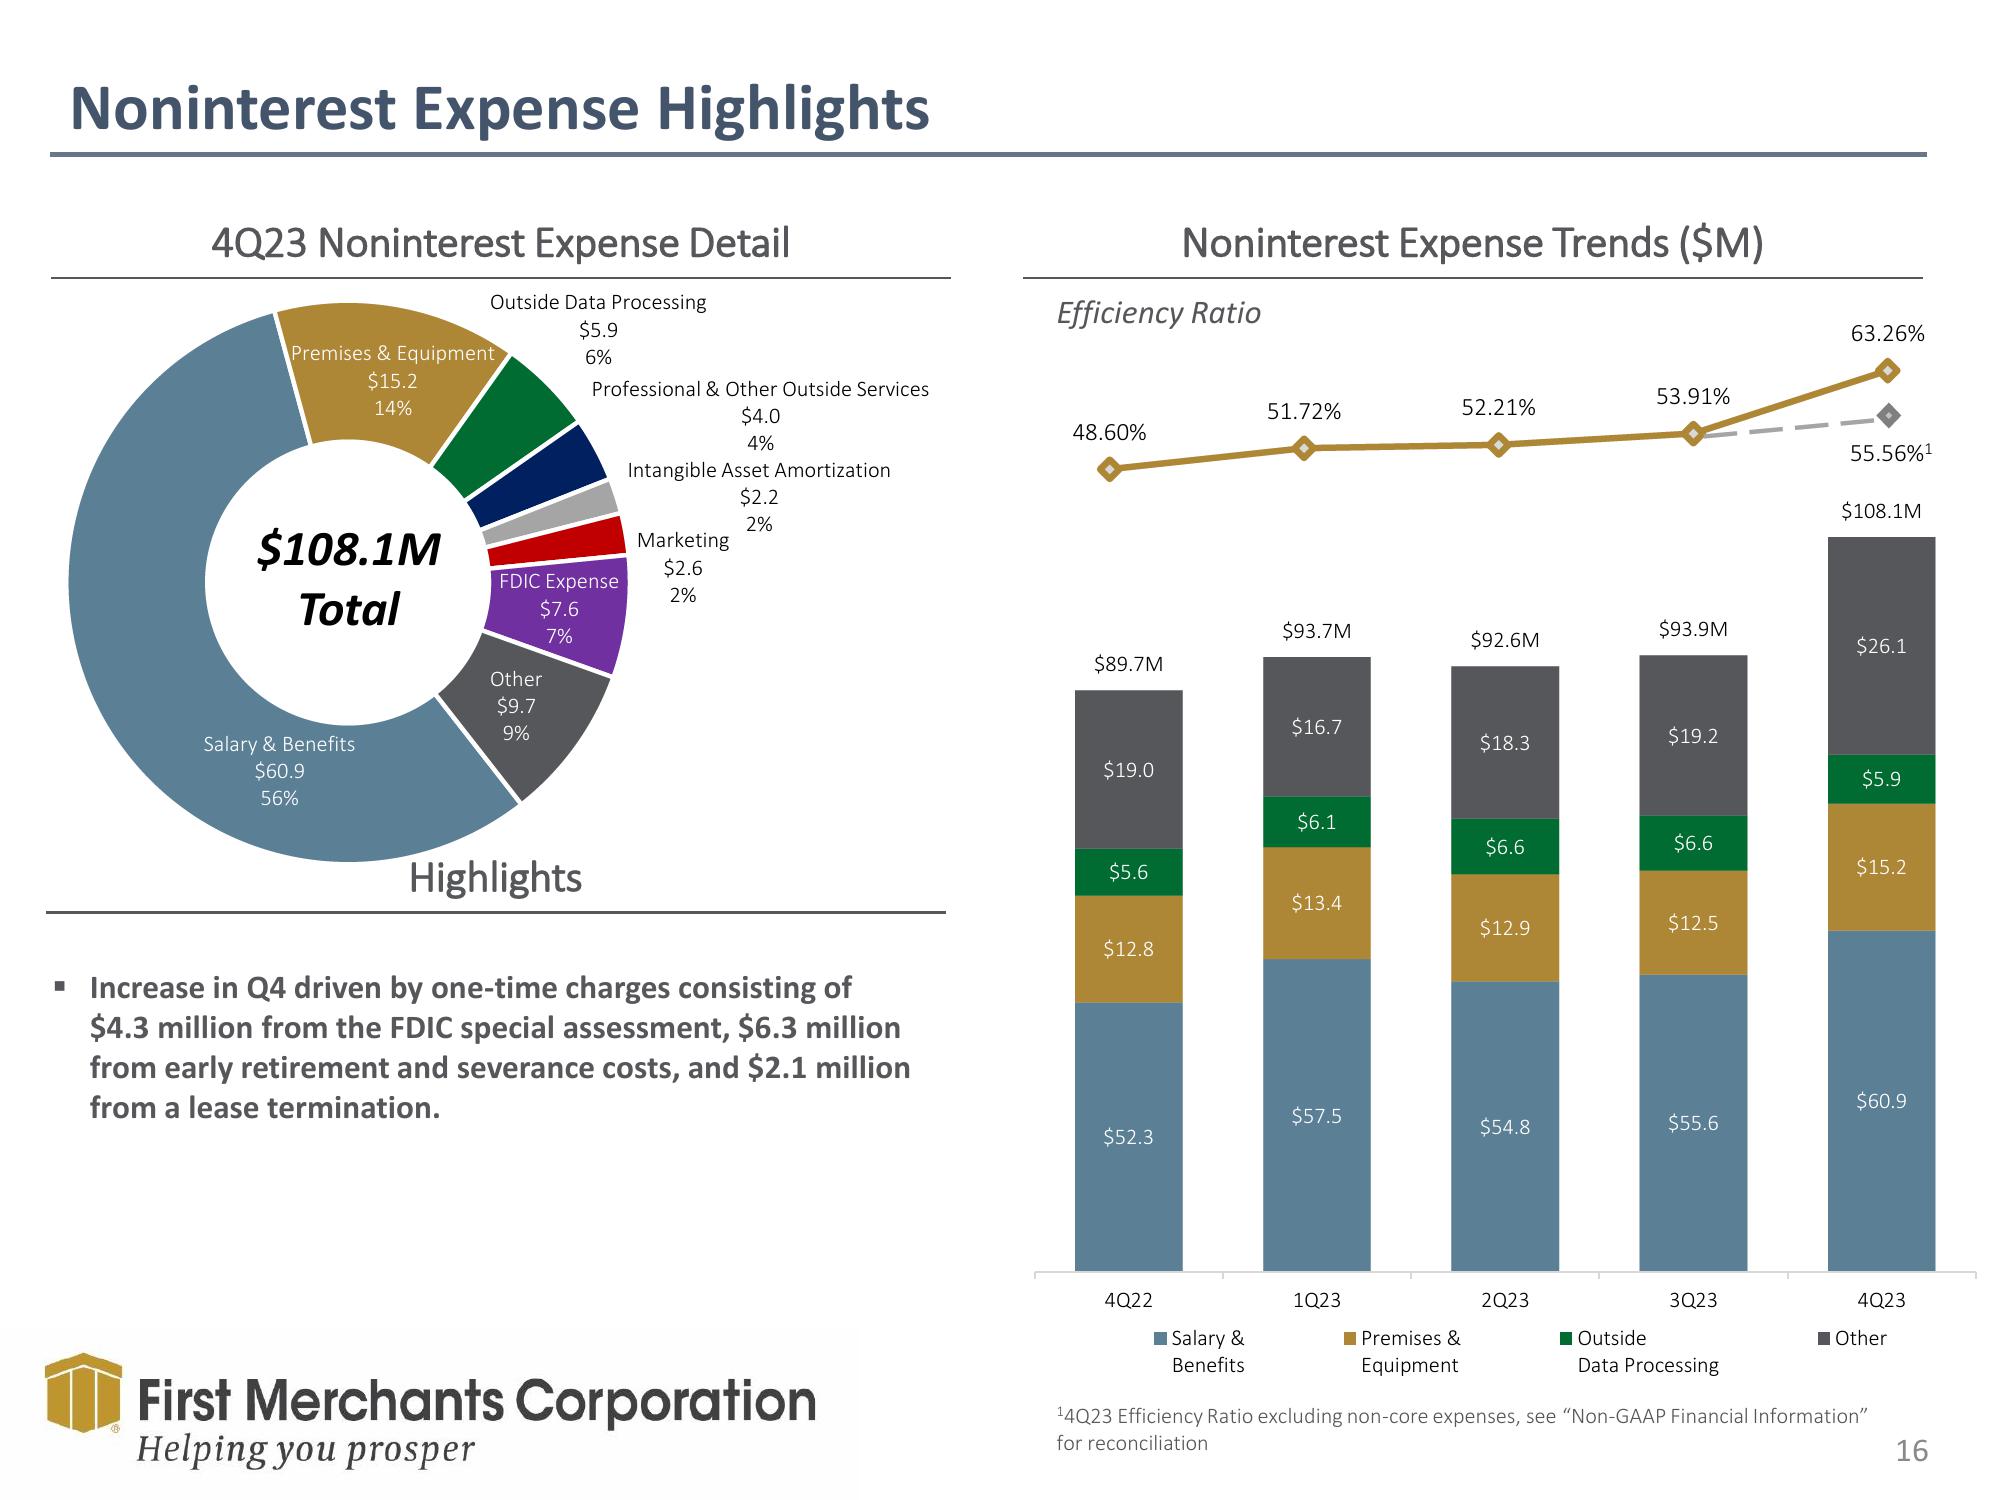
■ Increase in Q4 driven by one-time charges consisting of
$4.3 million from the FDIC special assessment, $6.3 million
from early retirement and severance costs, and $2.1 million
from a lease termination.
First Merchants Corporation
Helping you prosper
Efficiency Ratio
48.60%
$89.7M
$19.0
$5.6
$12.8
$52.3
Noninterest Expense Trends ($M)
4Q22
Salary &
Benefits
51.72%
$93.7M
$16.7
$6.1
$13.4
$57.5
1Q23
52.21%
■ Premises &
Equipment
$92.6M
$18.3
$6.6
$12.9
$54.8
2Q23
53.91%
$93.9M
$19.2
$6.6
$12.5
$55.6
3Q23
Outside
Data Processing
63.26%
55.56%¹
$108.1M
$26.1
$5.9
$15.2
$60.9
4Q23
Other
14Q23 Efficiency Ratio excluding non-core expenses, see "Non-GAAP Financial Information"
for reconciliation
16View entire presentation