Maersk Investor Presentation Deck
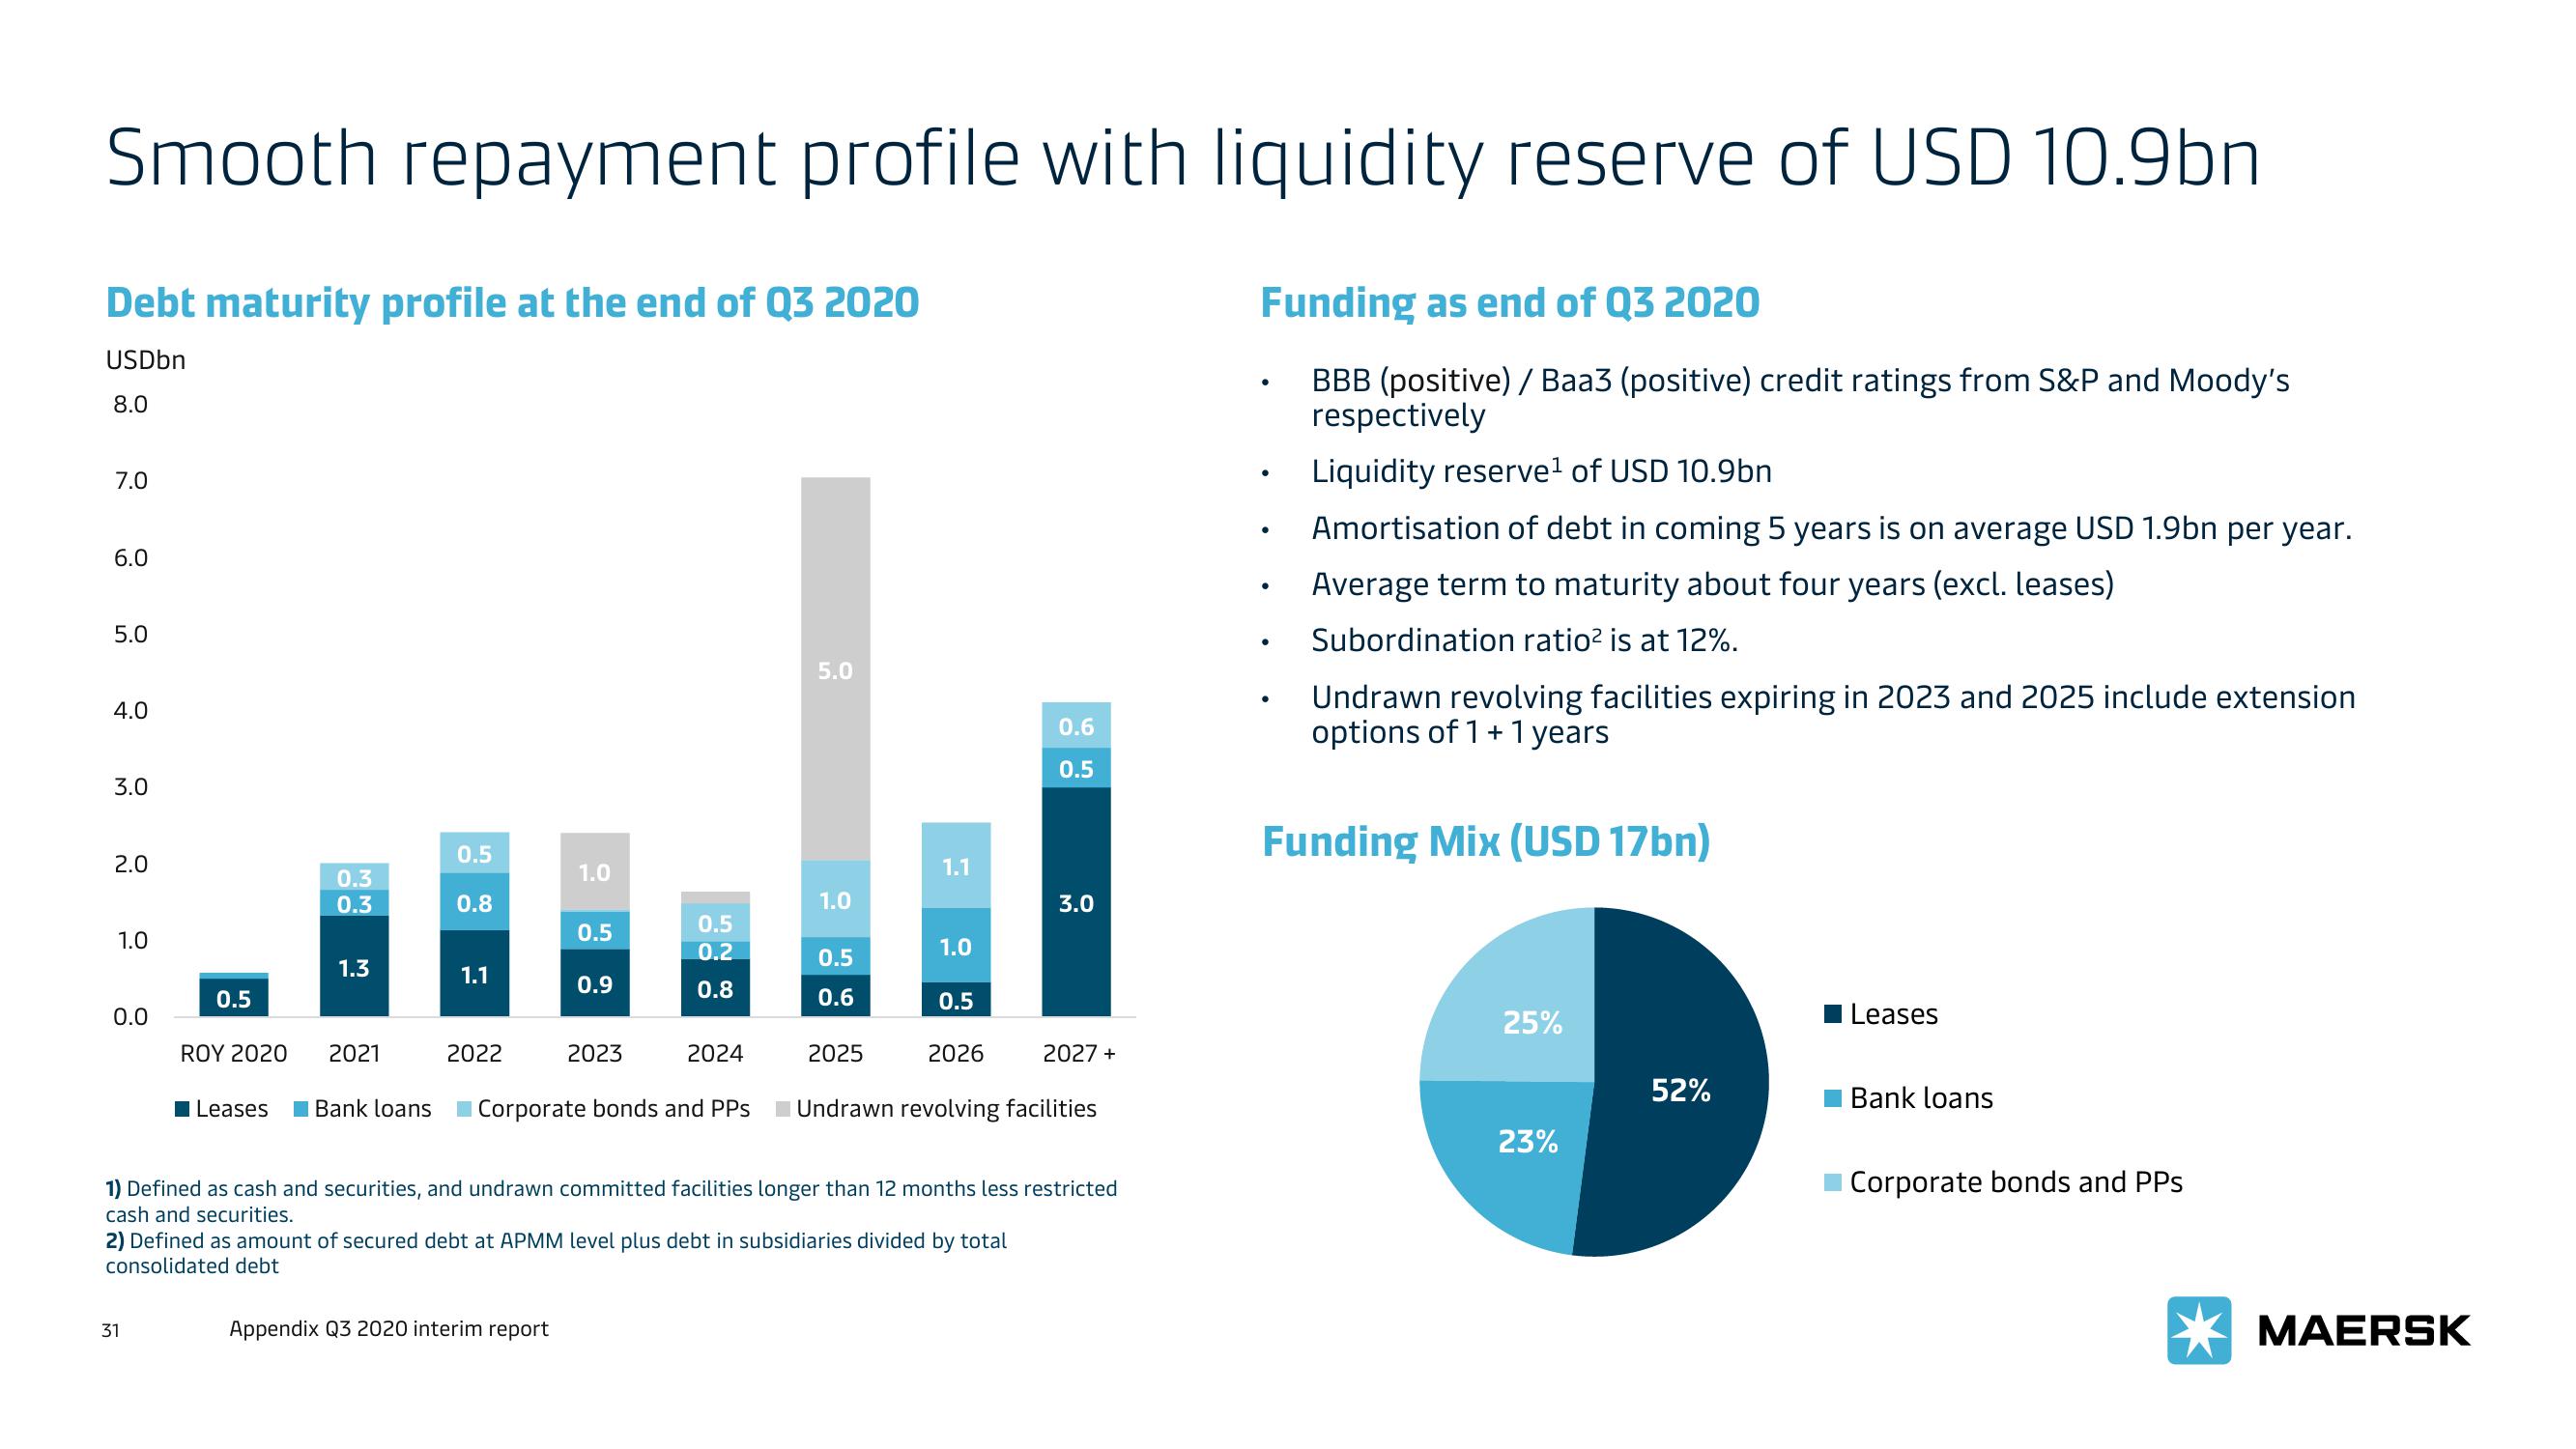
Smooth repayment profile with liquidity reserve of USD 10.9bn
Debt maturity profile at the end of Q3 2020
USDbn
8.0
7.0
6.0
5.0
4.0
3.0
2.0
1.0
0.0
0.5
31
0.3
0.3
Leases
1.3
ROY 2020 2021
0.5
0.8
1.1
2022
1.0
0.5
0.9
Appendix Q3 2020 interim report
2023
0.5
0.2
0.8
2024
Bank loans Corporate bonds and PPs
5.0
1.0
0.5
0.6
2025
1.1
1.0
0.5
2026
2) Defined as amount of secured debt at APMM level plus debt in subsidiaries divided by total
consolidated debt
0.6
0.5
3.0
1) Defined as cash and securities, and undrawn committed facilities longer than 12 months less restricted
cash and securities.
2027 +
Undrawn revolving facilities
Funding as end of Q3 2020
BBB (positive) / Baa3 (positive) credit ratings from S&P and Moody's
respectively
●
●
●
●
Liquidity reserve¹ of USD 10.9bn
Amortisation of debt in coming 5 years is on average USD 1.9bn per year.
Average term to maturity about four years (excl. leases)
Subordination ratio² is at 12%.
Undrawn revolving facilities expiring in 2023 and 2025 include extension
options of 1 + 1 years
Funding Mix (USD 17bn)
25%
23%
52%
Leases
Bank loans
Corporate bonds and PPs
MAERSKView entire presentation