OpenText Investor Presentation Deck
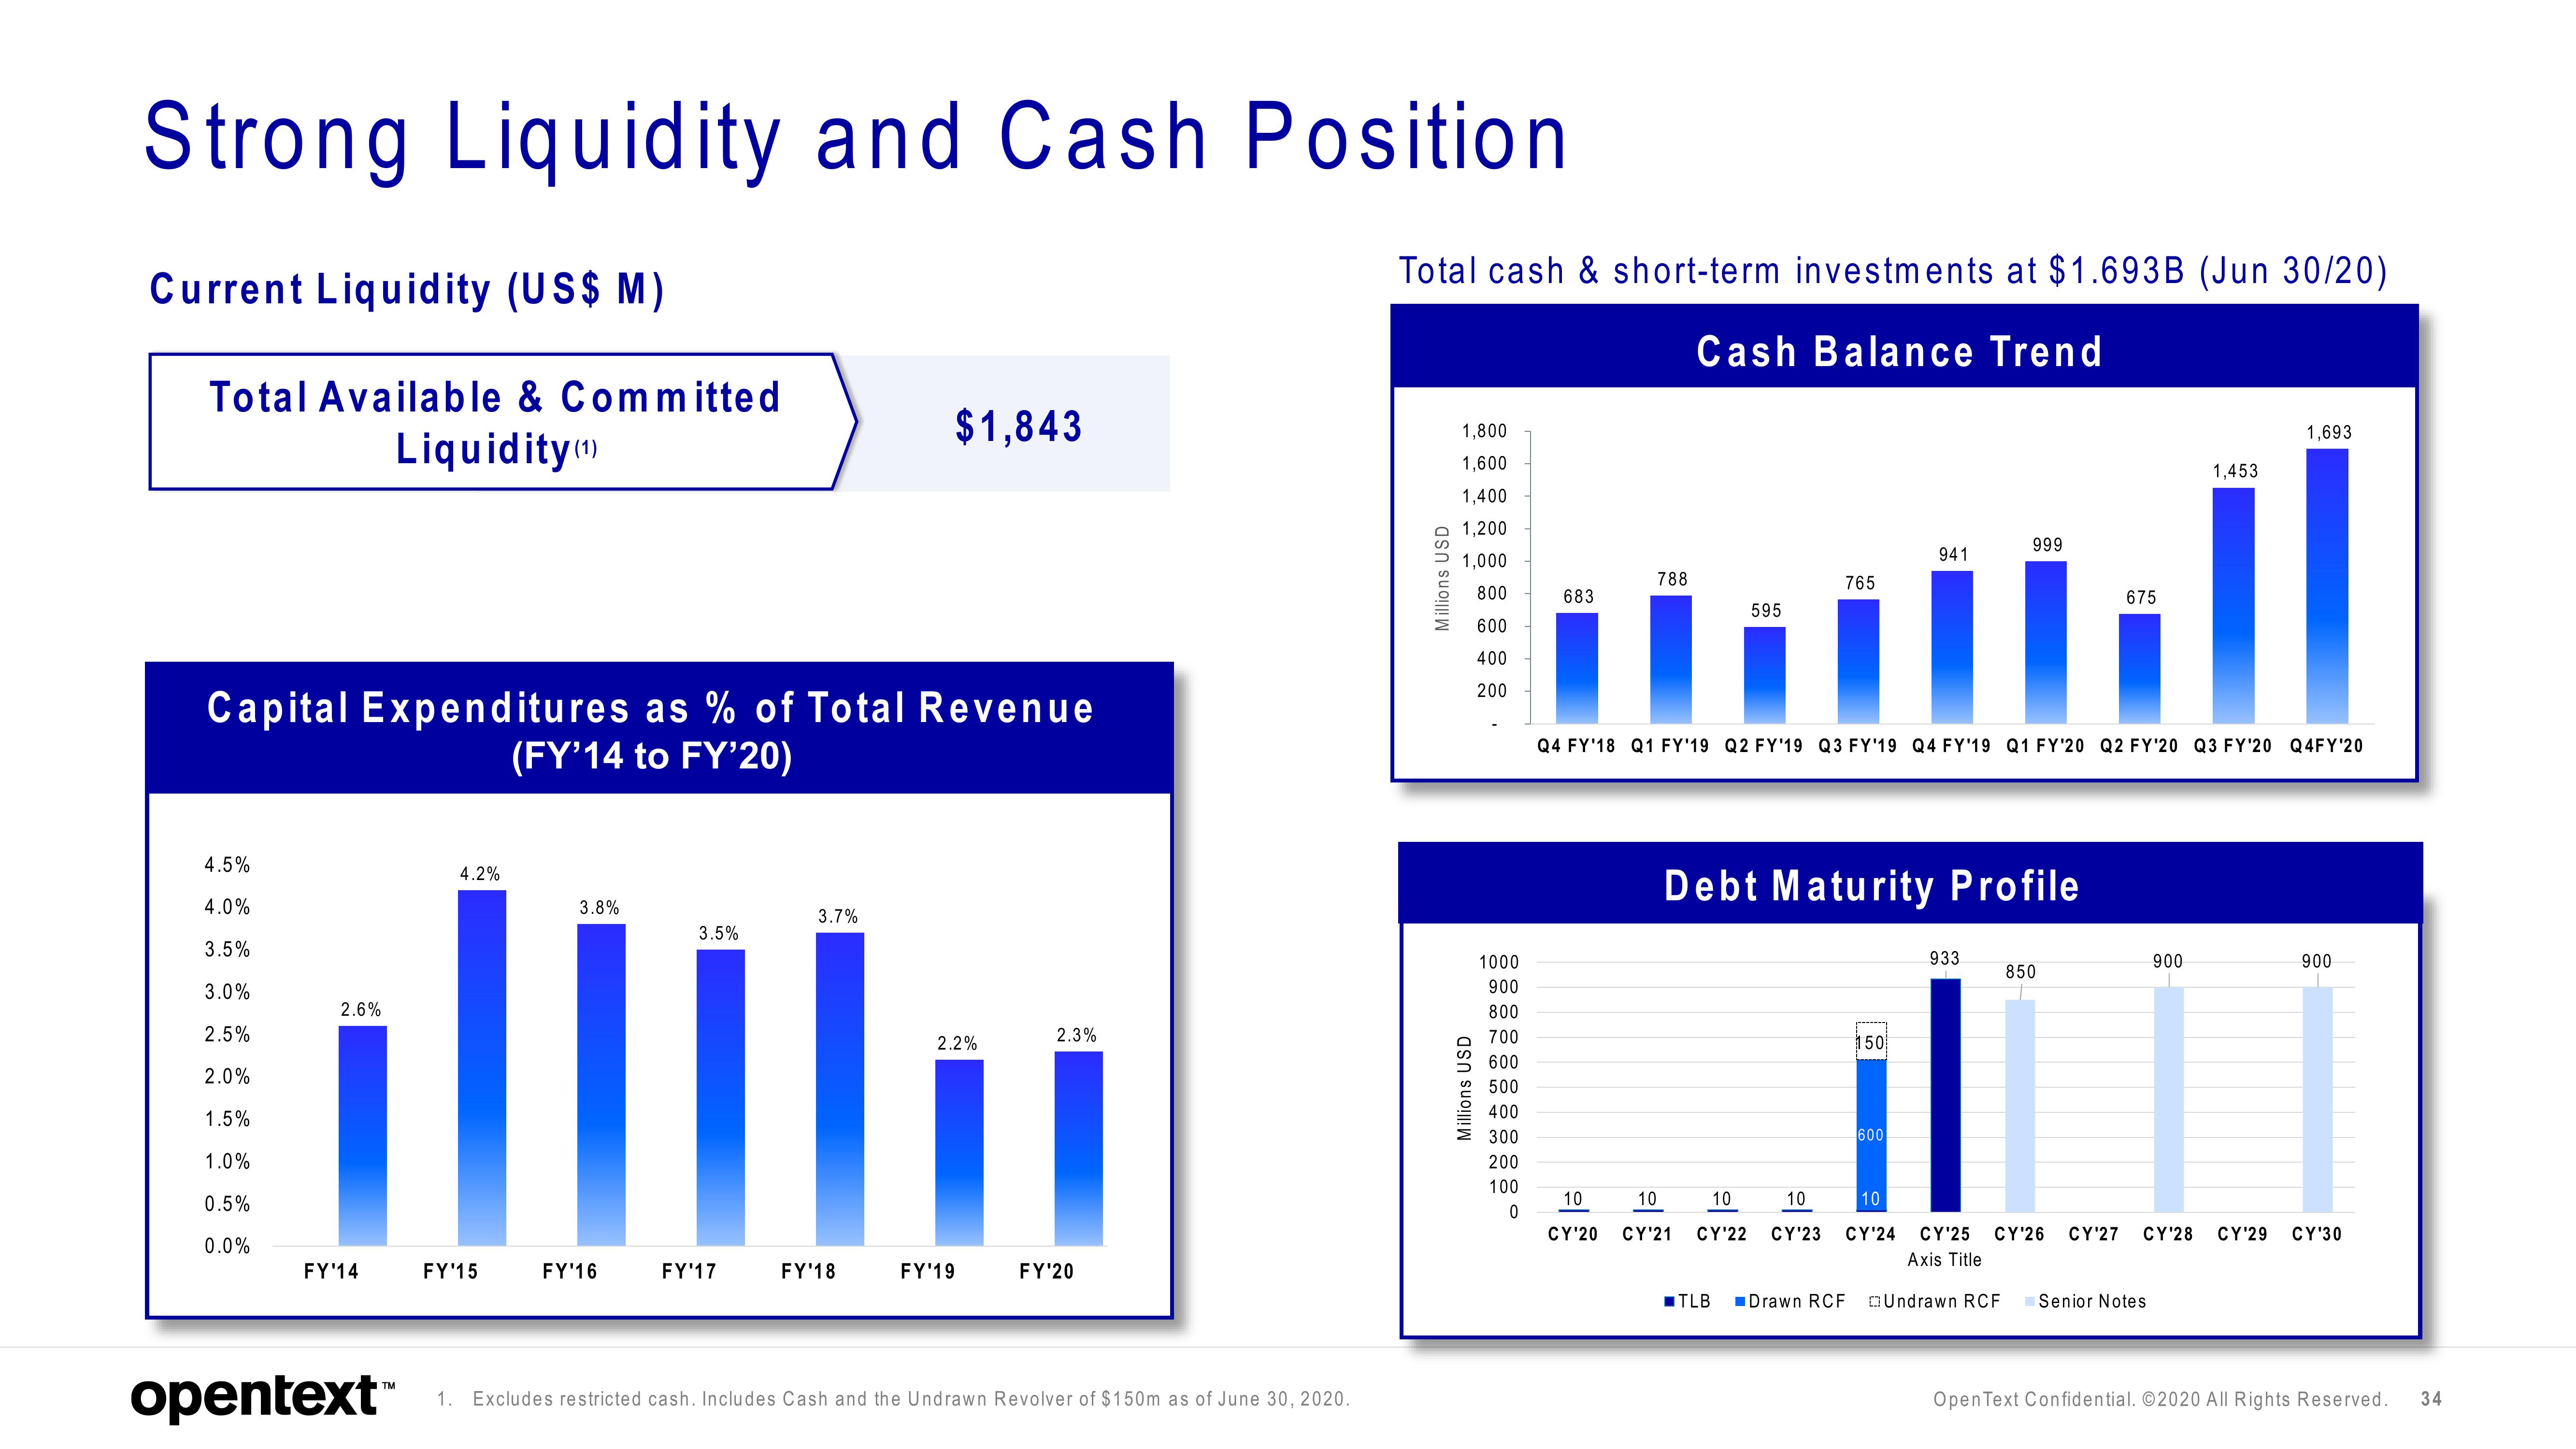
Strong Liquidity and Cash Position.
Current Liquidity (US$ M)
Total Available & Committed
Liquidity (¹)
Capital Expenditures as % of Total Revenue
(FY'14 to FY'20)
4.5%
4.0%
3.5%
3.0%
2.5%
2.0%
1.5%
1.0%
0.5%
0.0%
2.6%
FY'14
opentext™
4.2%
FY'15
3.8%
3.5%
III
FY'16
3.7%
FY'17
$1,843
FY'18
2.2%
FY'19
2.3%
FY'20
1. Excludes restricted cash. Includes Cash and the Undrawn Revolver of $150m as of June 30, 2020.
Total cash & short-term investments at $1.693B (Jun 30/20)
Cash Balance Trend
Millions USD
1,800
1,600
1,400
1,200
1,000
Millions USD
800
600
400
200
1000
900
800
700
600
500
400
300
200
100
0
683
788
765
10 10 10 10
CY'20 CY'21 CY'22 CY¹23
■TLB
Debt Maturity Profile
595
i
Q4 FY'18 Q1 FY'19 Q2 FY'19 Q3 FY'19 Q4 FY'19 Q1 FY'20 Q2 FY'20 Q3 FY'20 Q4FY'20
150
■Drawn RCF
941
600
10
CY'24
999
933
Undrawn RCF
850
CY'25 CY'26
Axis Title
675
1,453
900
Senior Notes.
1,693
900
CY'27 CY'28 CY'29 CY'30
Open Text Confidential. ©2020 All Rights Reserved.
34View entire presentation