OpenText Investor Presentation Deck
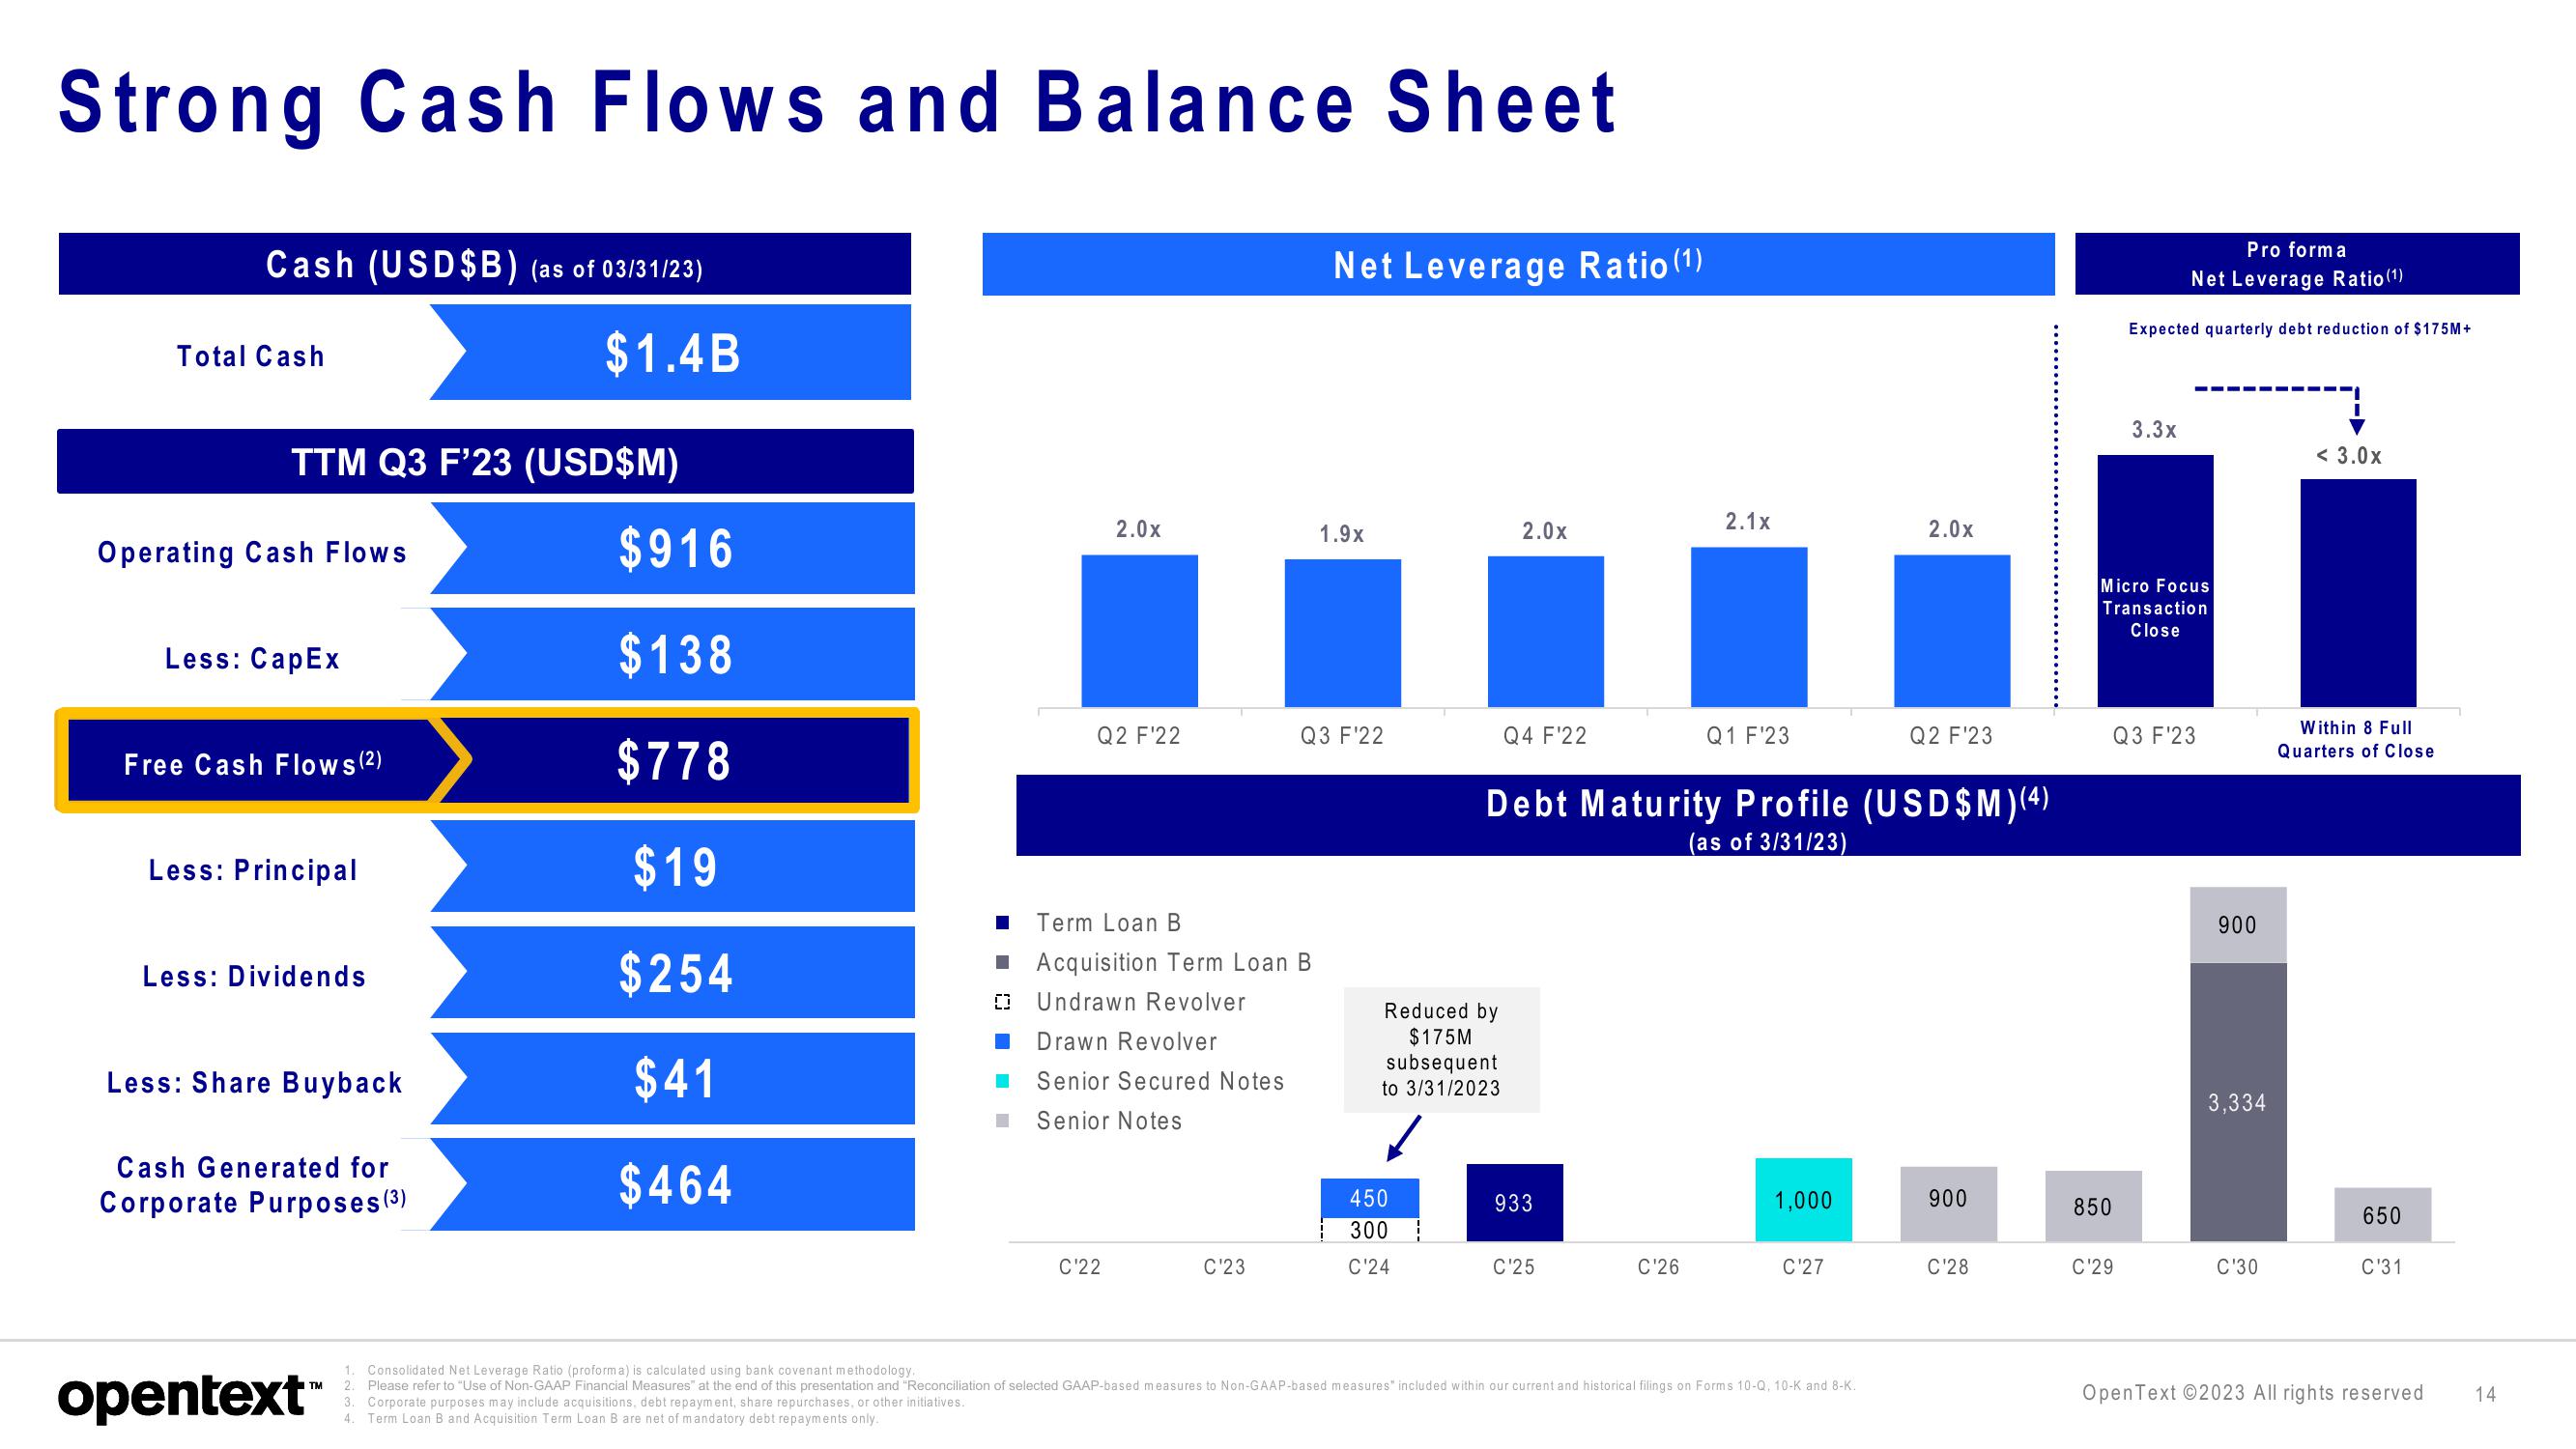
Strong Cash Flows and Balance Sheet
Cash (USD$B) (as of 03/31/23)
$1.4B
Total Cash
TTM Q3 F'23 (USD$M)
Operating Cash Flows
Less: CapEx
Free Cash Flows (²)
Less: Principal
Less: Dividends
Less: Share Buyback
Cash Generated for
Corporate Purposes (³)
opentext™
$916
$138
$778
$19
$254
$41
$464
2.0x
Q2 F¹22
I Term Loan B
Acquisition Term Loan B
0 Undrawn Revolver
Drawn Revolver
Senior Secured Notes
Senior Notes
C'22
C'23
Net Leverage Ratio (¹)
1.9x
Q3 F'22
Reduced by
$175M
subsequent
to 3/31/2023
450
300
C'24
2.0x
Q4 F¹22
933
C'25
2.1x
Debt Maturity Profile (USD$M)(4)
(as of 3/31/23)
C'26
Q1 F¹23
1,000
C'27
2.0x
1. Consolidated Net Leverage Ratio (proforma) is calculated using bank covenant methodology.
2. Please refer to "Use of Non-GAAP Financial Measures" at the end of this presentation and "Reconciliation of selected GAAP-based measures to Non-GAAP-based measures" included within our current and historical filings on Forms 10-Q, 10-K and 8-K.
3. Corporate purposes may include acquisitions, debt repayment, share repurchases, or other initiatives.
4. Term Loan B and Acquisition Term Loan B are net of mandatory debt repayments only.
Q2 F¹23
900
C'28
850
Pro forma
Net Leverage Ratio (¹)
Expected quarterly debt reduction of $175M+
3.3x
Micro Focus
Transaction
Close
C'29
Q3 F¹23
900
3,334
C'30
< 3.0x
Within 8 Full
Quarters of Close
650
C'31
OpenText ©2023 All rights reserved
14View entire presentation