J.P.Morgan Results Presentation Deck
JPMORGAN CHASE & CO.
CAPITAL AND OTHER SELECTED BALANCE SHEET ITEMS
(in millions, except ratio data)
CAPITAL (a)
Risk-based capital metrics
Standardized
CET1 capital
Tier 1 capital
Total capital
Risk-weighted assets
CET1 capital ratio
Tier 1 capital ratio
Total capital ratio
Advanced
CET1 capital
Tier 1 capital
Total capital
Risk-weighted assets
CET1 capital ratio
Tier 1 capital ratio
Total capital ratio
Leverage-based capital metrics
Adjusted average assets (b)
Tier 1 leverage ratio
Total leverage exposure
SLR
TANGIBLE COMMON EQUITY (period-end) (c)
Common stockholders' equity
Less: Goodwill
Less: Other intangible assets
Add: Certain deferred tax liabilities (d)
Total tangible common equity
TANGIBLE COMMON EQUITY (average) (c)
Common stockholders' equity
Less: Goodwill
Less: Other intangible assets
Add: Certain deferred tax liabilities (d)
Total tangible common equity
INTANGIBLE ASSETS (period-end)
Goodwill
Mortgage servicing rights
Other intangible assets
Total intangible assets
Sep 30,
2022
$ 209,661 (e) $ 207,436
236,354 (e) 239,705
268,104 (e) 268,339
1,682,182 (e) 1,704,893
12.5% (e)
14.1 (e)
15.9 (e)
$209,661 (e)
236,354 (e)
256,204 (e)
1,614,348 (e)
13.0 % (e)
14.6 (e)
15.9 (e)
$4,461,013 (e)
5.3% (e)
$ 255,180
51,461
1,205
2,509
$ 205,023
$ 252,944
51,323
1,208
2,512
$ 202,925
Jun 30,
2022
$3,791,795 (e) $3,861,979
6.2 % (e)
6.2 %
$ 51,461
8,140
1,205
60,806
$
12.2 %
14.1
15.7
$207,436
239,705
257,329
1,613,210
12.9 %
14.9
16.0
$4,563,099
5.3%
$253,305
50,697
1,224
2,509
$ 203,893
$247,986
50,575
1,119
2,503
$ 198,795
$ 50,697
7,439
1,224
$ 59,360
Mar 31,
2022
$207,903
240,076
269,536
1,750,678
11.9 %
13.7
15.4
$207,903
240,076
258,989
1,643,453
12.7 %
14.6
15.8
$3,857,783
6.2 %
$4,586,537
5.2 %
$ 253,061
50,298
893
2,496
$ 204,366
$ 252,506
50,307
896
2,498
$ 203,801
$ 50,298
7,294
893
$ 58,485
Dec 31,
2021
$213,942
246,162
274,900
1,638,900
13.1 %
15.0
16.8
$213,942
246,162
265,796
1,547,920
13.8 %
15.9
17.2
$3,782,035
6.5 %
$4,571,789
5.4 %
$259,289
50,315
882
2,499
$ 210,591
$ 253,805
50,362
896
2,502
$ 205,049
$ 50,315
5,494
882
$ 56,691
Sep 30,
2021
$ 209,917
244,207
274,994
1,628,406
12.9 %
15.0
16.9
$209,917
244,207
264,469
1,544,512
13.6 %
15.8
17.1
$3,675,803
6.6 %
$4,463,904
5.5 %
$ 255,203
50,313
902
2,500
$206,488
$ 253,556
49,457
849
2,480
$ 205,730
$ 50,313
5,351
902
$ 56,566
Sep 30, 2022
Change
Jun 30,
2022
1%
(1)
(1)
- €11
(2)
(2)
1
2
(2)
1
N 100 N
2
9
(2)
2
JPMORGAN CHASE & CO.
Sep 30,
2021
(3)
3
2
34
(1)
|
4
42
1
%
(1)
2
52
34
7
NINE MONTHS ENDED SEPTEMBER 30,
2022
$ 251,147
50,739
1,076
2,504
$ 201,836
2021
$ 250,011
49,323
868
2,465
$ 202,285
2022 Change
2021
%
| NEW !
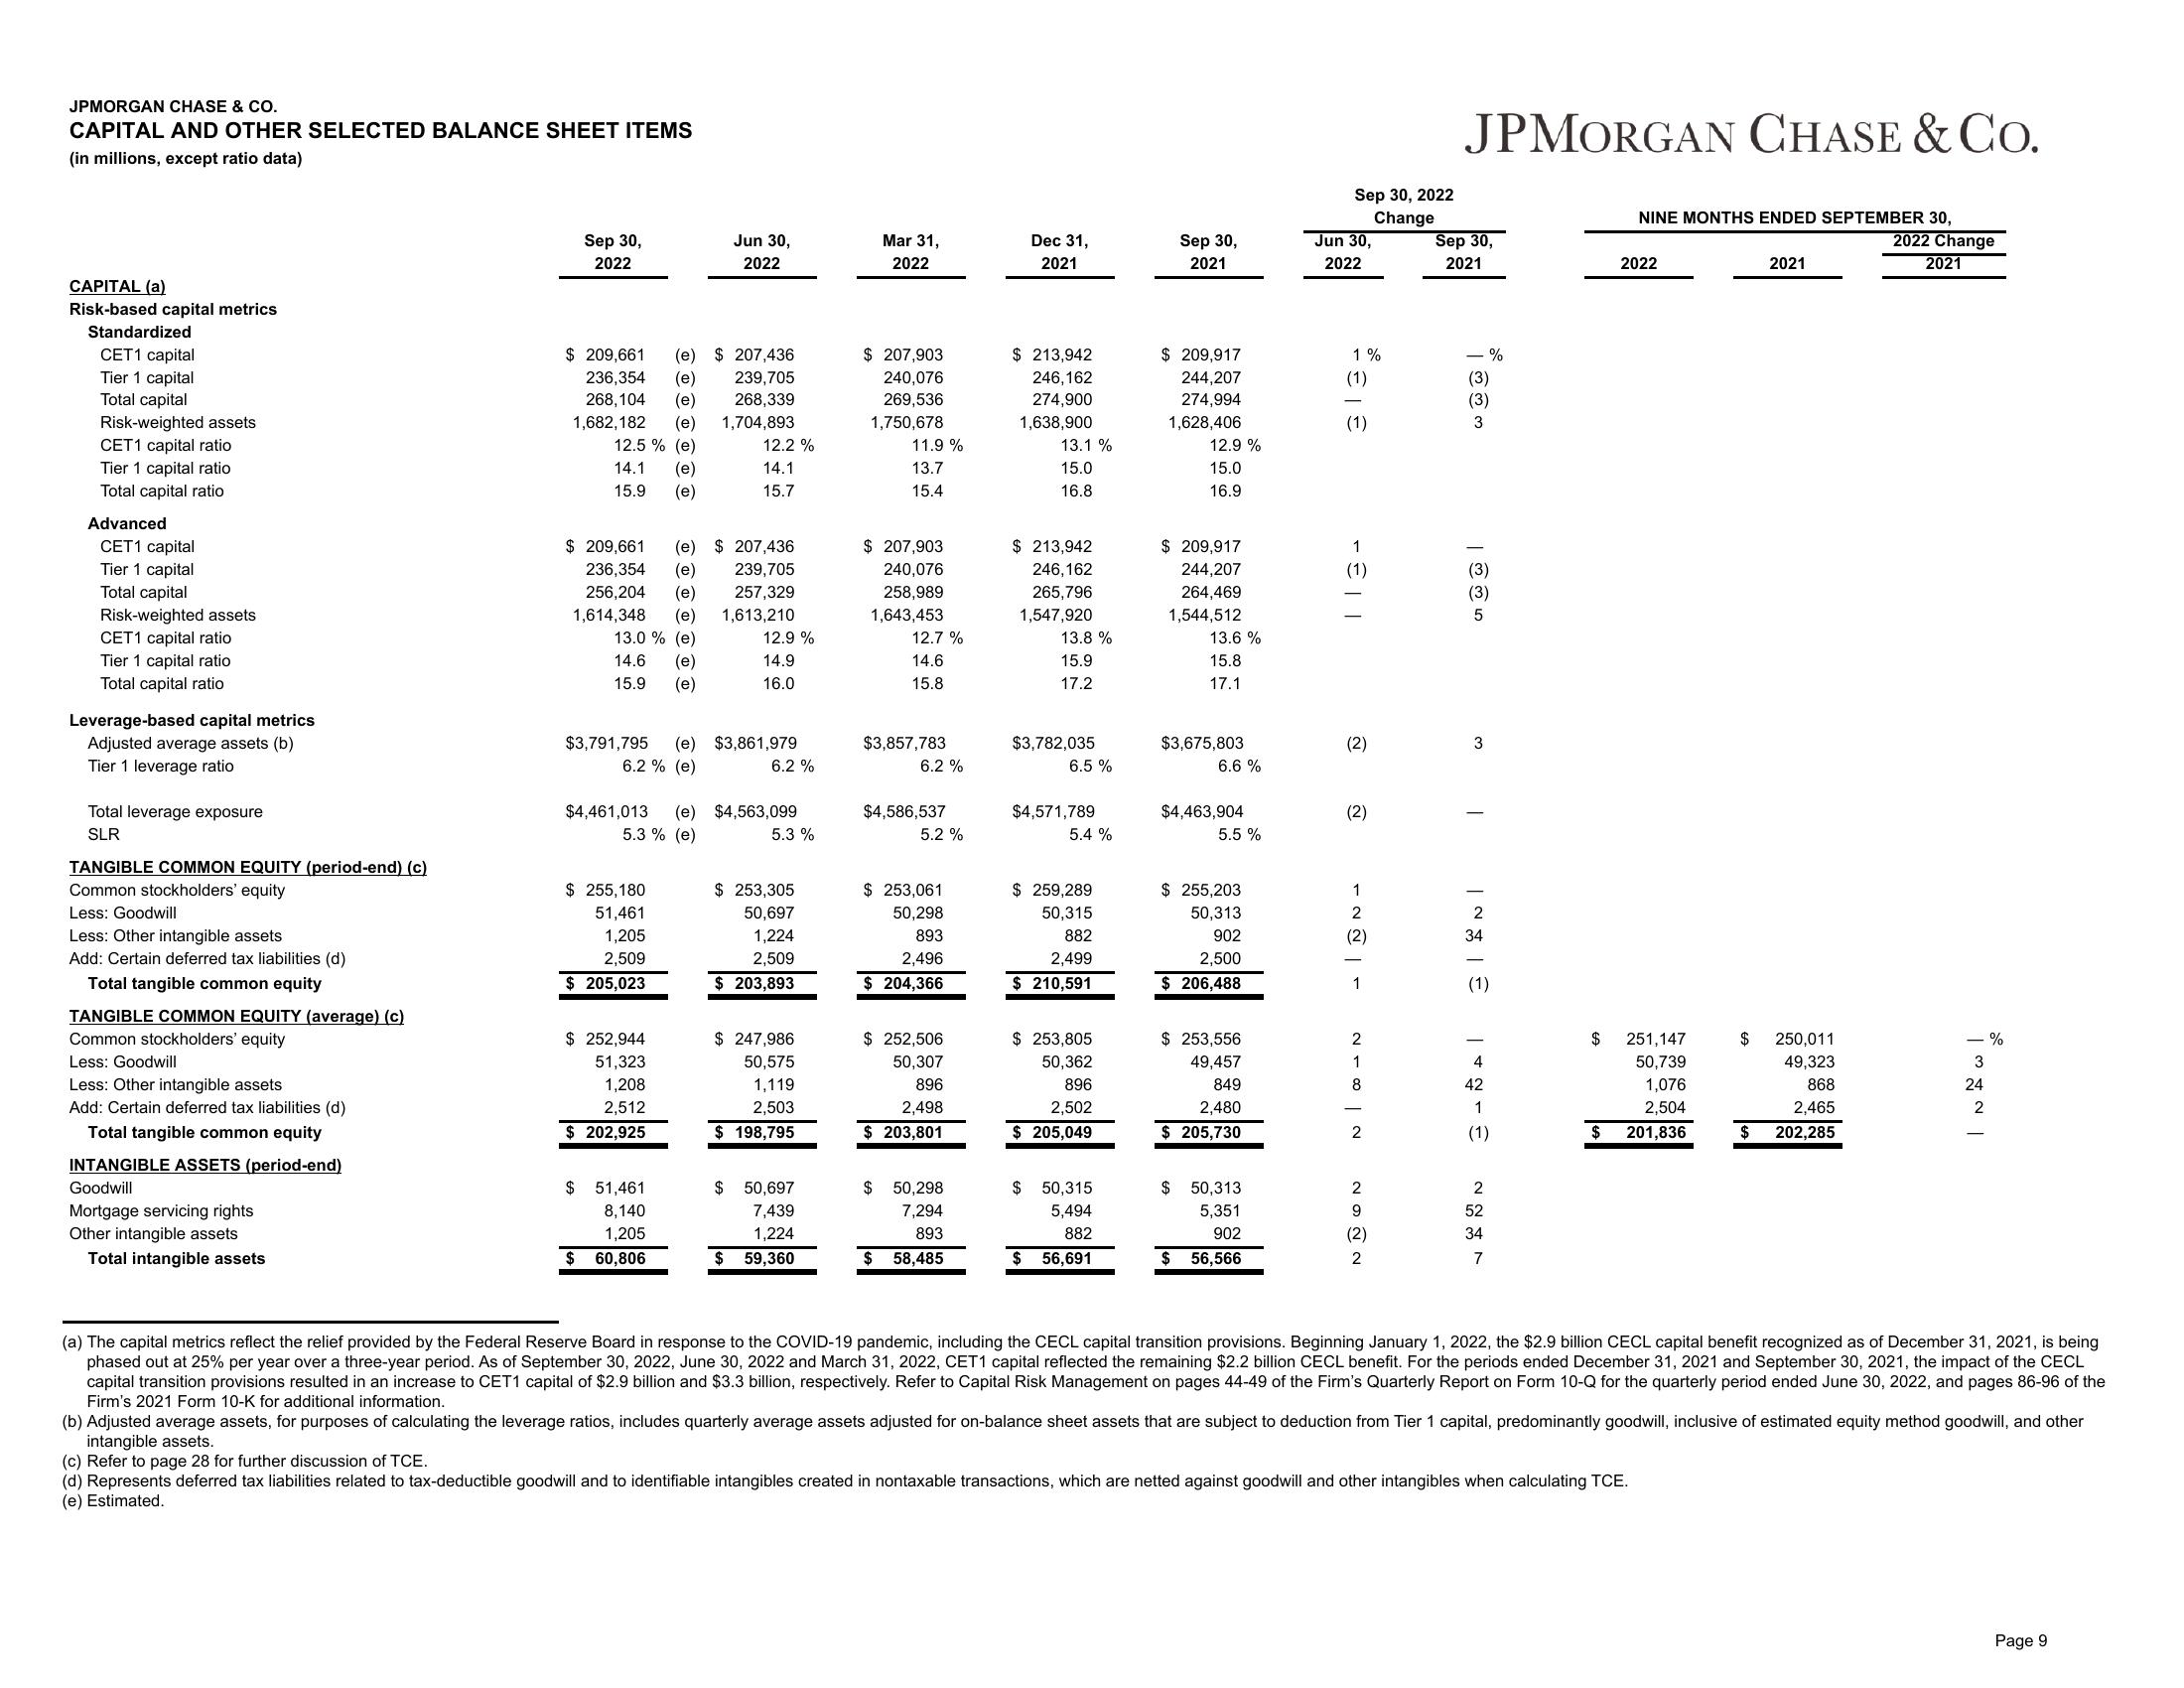
(a) The capital metrics reflect the relief provided by the Federal Reserve Board in response to the COVID-19 pandemic, including the CECL capital transition provisions. Beginning January 1, 2022, the $2.9 billion CECL capital benefit recognized as of December 31, 2021, is being
phased out at 25% per year over a three-year period. As of September 30, 2022, June 30, 2022 and March 31, 2022, CET1 capital reflected the remaining $2.2 billion CECL benefit. For the periods ended December 31, 2021 and September 30, 2021, the impact of the CECL
capital transition provisions resulted in an increase to CET1 capital of $2.9 billion and $3.3 billion, respectively. Refer to Capital Risk Management on pages 44-49 of the Firm's Quarterly Report on Form 10-Q for the quarterly period ended June 30, 2022, and pages 86-96 of the
Firm's 2021 Form 10-K for additional information.
(b) Adjusted average assets, for purposes of calculating the leverage ratios, includes quarterly average assets adjusted for on-balance sheet assets that are subject to deduction from Tier 1 capital, predominantly goodwill, inclusive of estimated equity method goodwill, and other
intangible assets.
(c) Refer to page 28 for further discussion of TCE.
(d) Represents deferred tax liabilities related to tax-deductible goodwill and to identifiable intangibles created in nontaxable transactions, which are netted against goodwill and other intangibles when calculating TCE.
(e) Estimated.
Page 9View entire presentation