Shopify Investor Presentation Deck
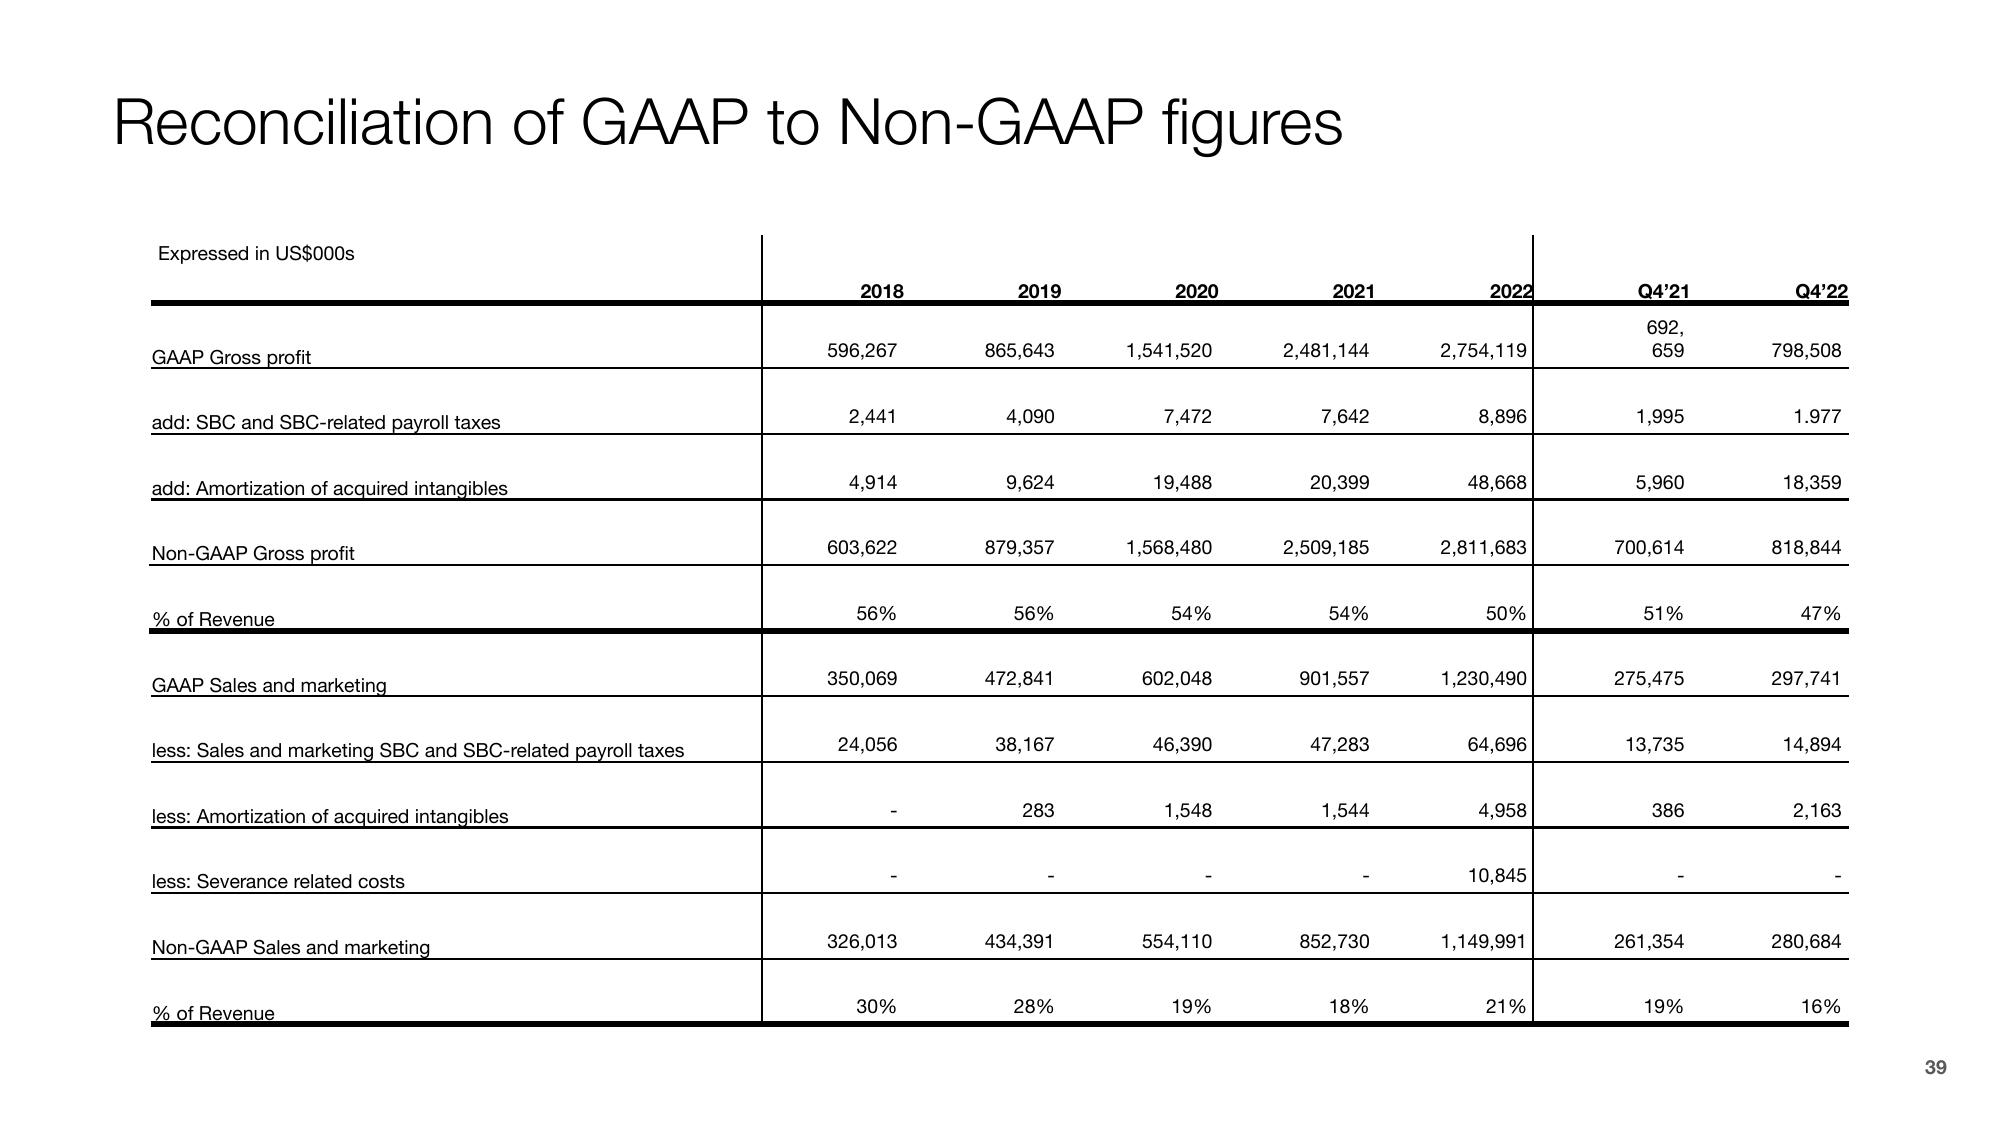
Reconciliation of GAAP to Non-GAAP figures
Expressed in US$000s
GAAP Gross profit
add: SBC and SBC-related payroll taxes
add: Amortization of acquired intangibles
Non-GAAP Gross profit
% of Revenue
GAAP Sales and marketing
less: Sales and marketing SBC and SBC-related payroll taxes
less: Amortization of acquired intangibles
less: Severance related costs
Non-GAAP Sales and marketing
% of Revenue
2018
596,267
2,441
4,914
603,622
56%
350,069
24,056
326,013
30%
2019
865,643
4,090
9,624
879,357
56%
472,841
38,167
283
434,391
28%
2020
1,541,520
7,472
19,488
1,568,480
54%
602,048
46,390
1,548
554,110
19%
2021
2,481,144
7,642
20,399
2,509,185
54%
901,557
47,283
1,544
852,730
18%
2022
2,754,119
8,896
48,668
2,811,683
50%
1,230,490
64,696
4,958
10,845
1,149,991
21%
Q4'21
692,
659
1,995
5,960
700,614
51%
275,475
13,735
386
261,354
19%
Q4'22
798,508
1.977
18,359
818,844
47%
297,741
14,894
2,163
280,684
16%
39View entire presentation