OpenText Investor Presentation Deck
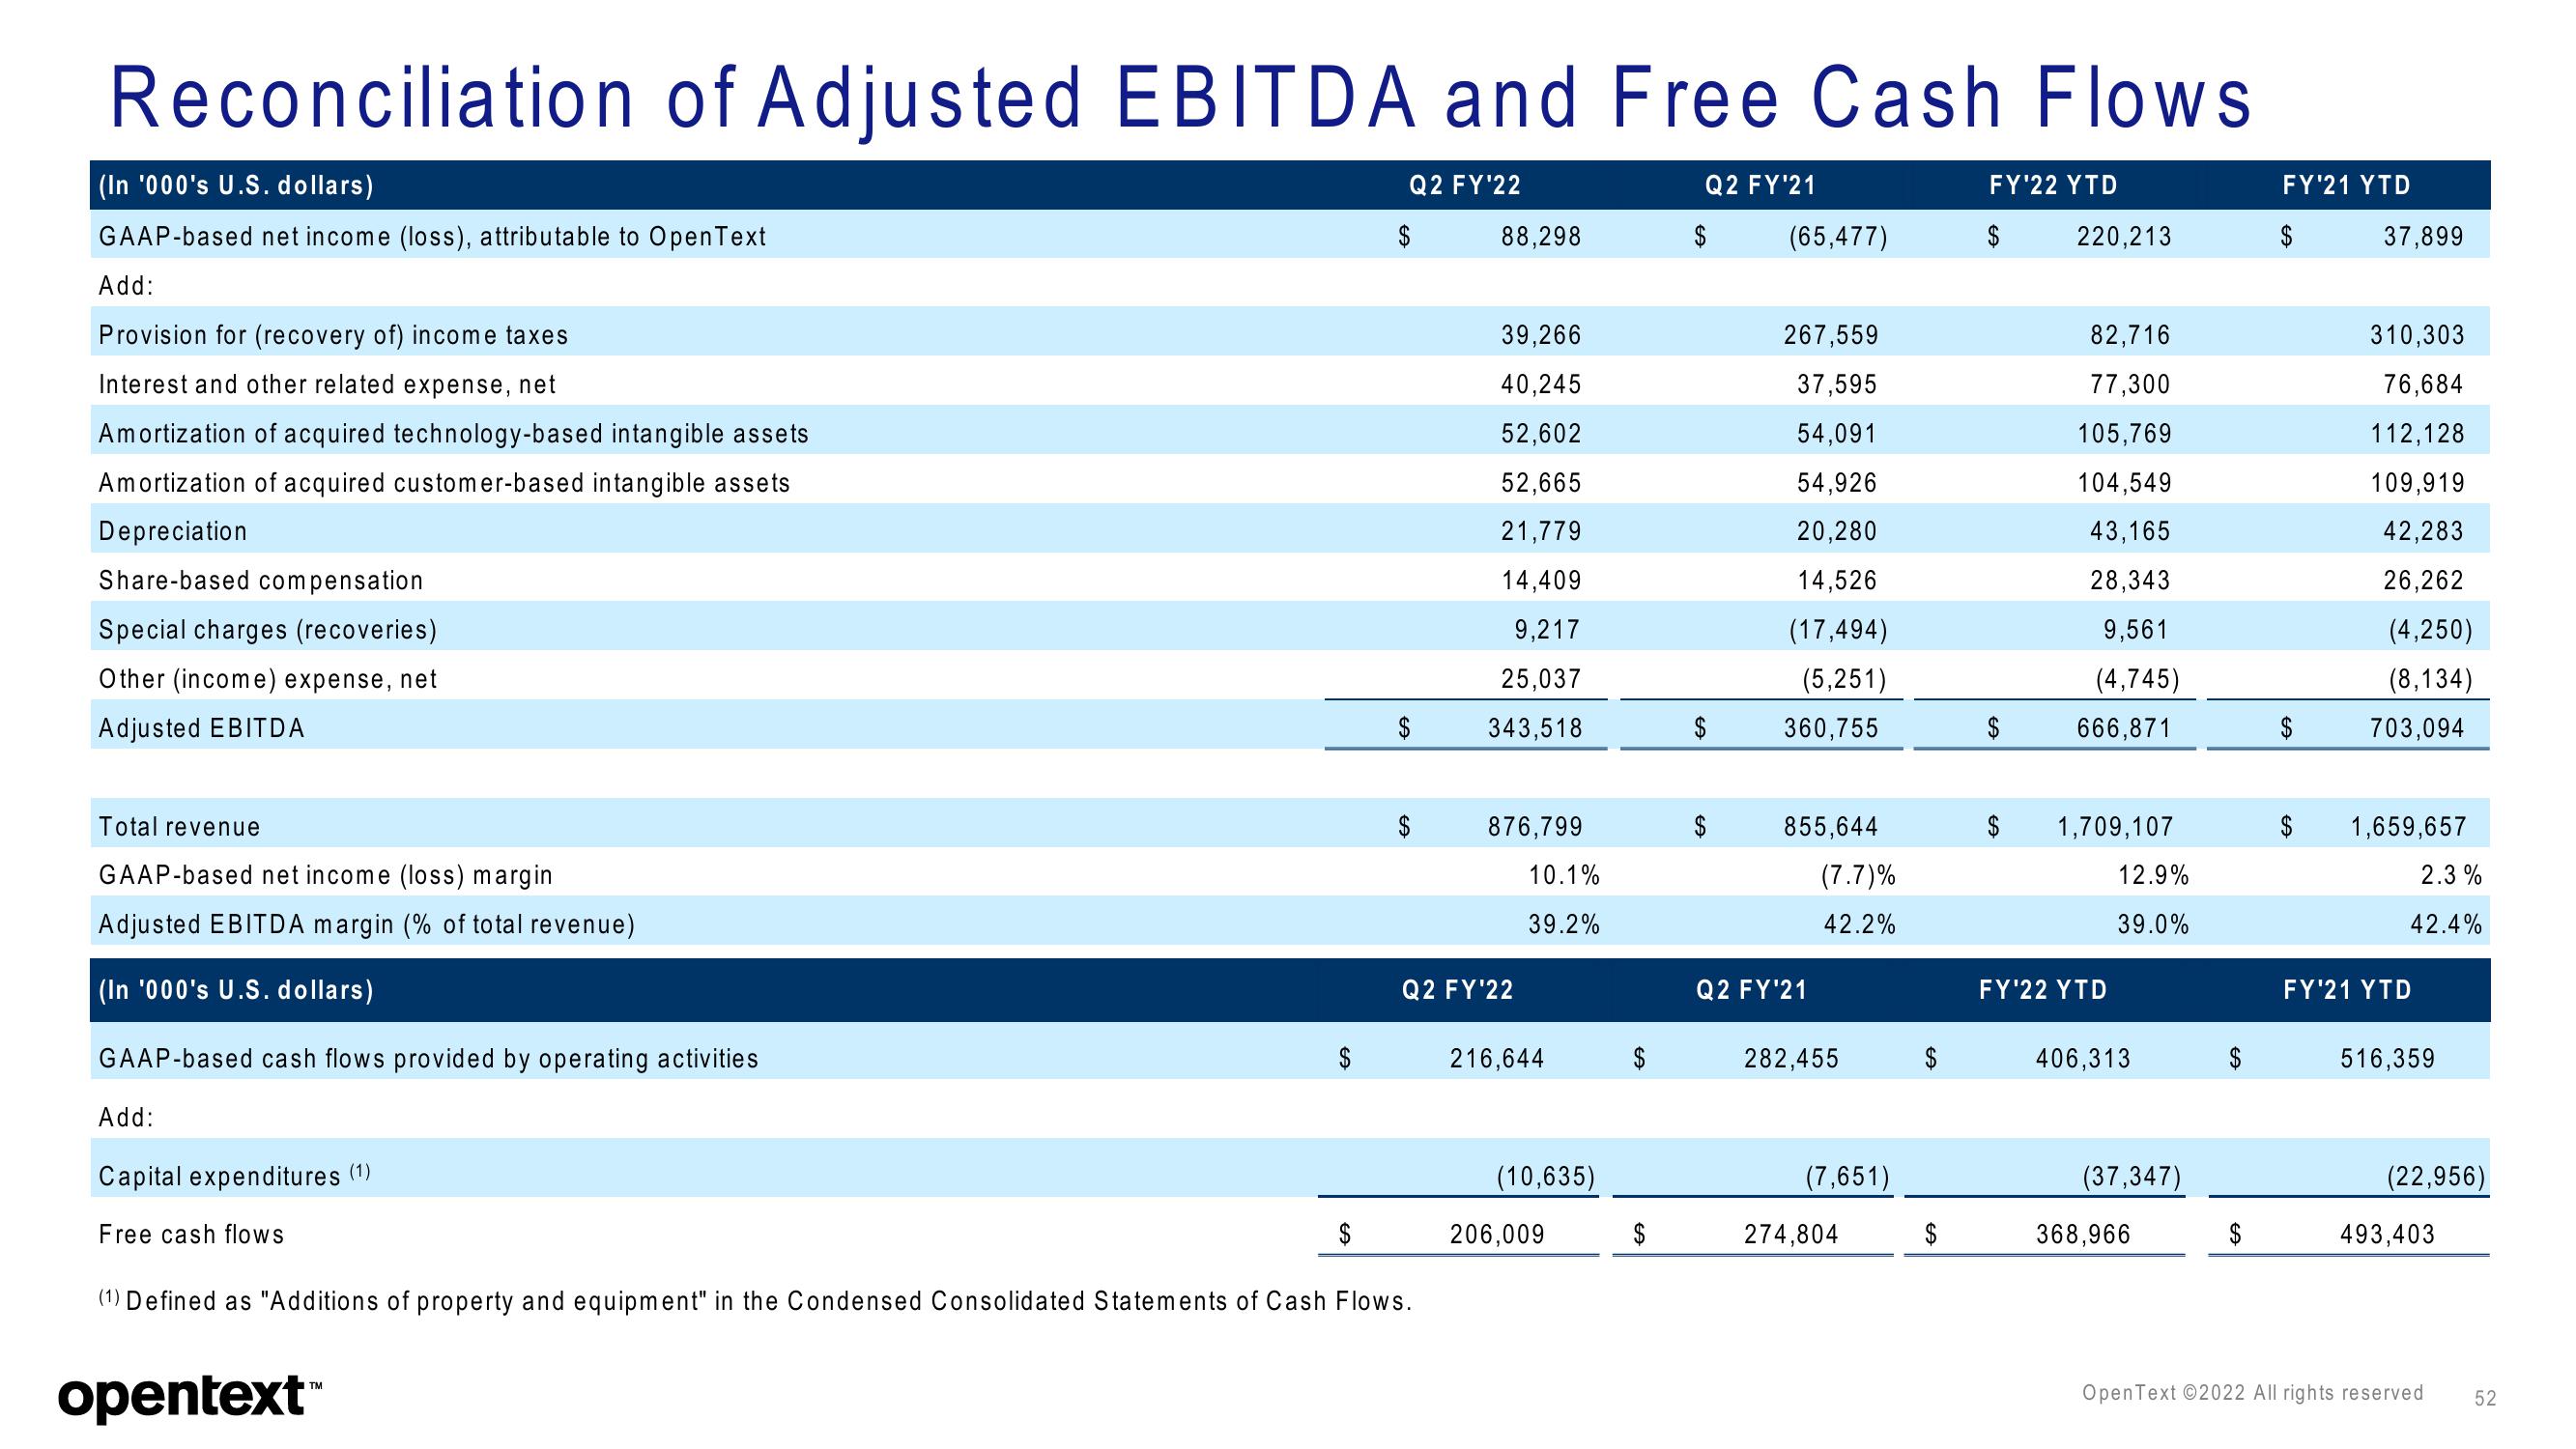
Reconciliation of Adjusted EBITDA and Free Cash Flows
Q2 FY'22
Q2 FY'21
(In '000's U.S. dollars)
GAAP-based net income (loss), attributable to Open Text
Add:
Provision for (recovery of) income taxes
Interest and other related expense, net
Amortization of acquired technology-based intangible assets
Amortization of acquired customer-based intangible assets
Depreciation
Share-based compensation
Special charges (recoveries)
Other (income) expense, net
Adjusted EBITDA
Total revenue
GAAP-based net income (loss) margin
Adjusted EBITDA margin (% of total revenue)
(In '000's U.S. dollars)
GAAP-based cash flows provided by operating activities
Add:
Capital expenditures (1)
Free cash flows
$
opentext™
(1) Defined as "Additions of property and equipment" in the Condensed Consolidated Statements of Cash Flows.
88,298
39,266
40,245
52,602
52,665
21,779
14,409
9,217
25,037
343,518
876,799
10.1%
39.2%
Q2 FY'22
216,644
(10,635)
206,009
$
$
(65,477)
267,559
37,595
54,091
54,926
20,280
14,526
(17,494)
(5,251)
360,755
855,644
(7.7)%
42.2%
Q2 FY¹21
282,455
(7,651)
274,804
$
FY'22 YTD
220,213
82,716
77,300
105,769
104,549
43,165
28,343
9,561
(4,745)
666,871
$ 1,709,107
12.9%
39.0%
FY'22 YTD
406,313
(37,347)
368,966
$
FY'21 YTD
$
37,899
310,303
76,684
112,128
109,919
42,283
26,262
(4,250)
(8,134)
703,094
1,659,657
2.3%
42.4%
FY'21 YTD
516,359
(22,956)
493,403
OpenText ©2022 All rights reserved
52View entire presentation