Fastly Investor Day Presentation Deck
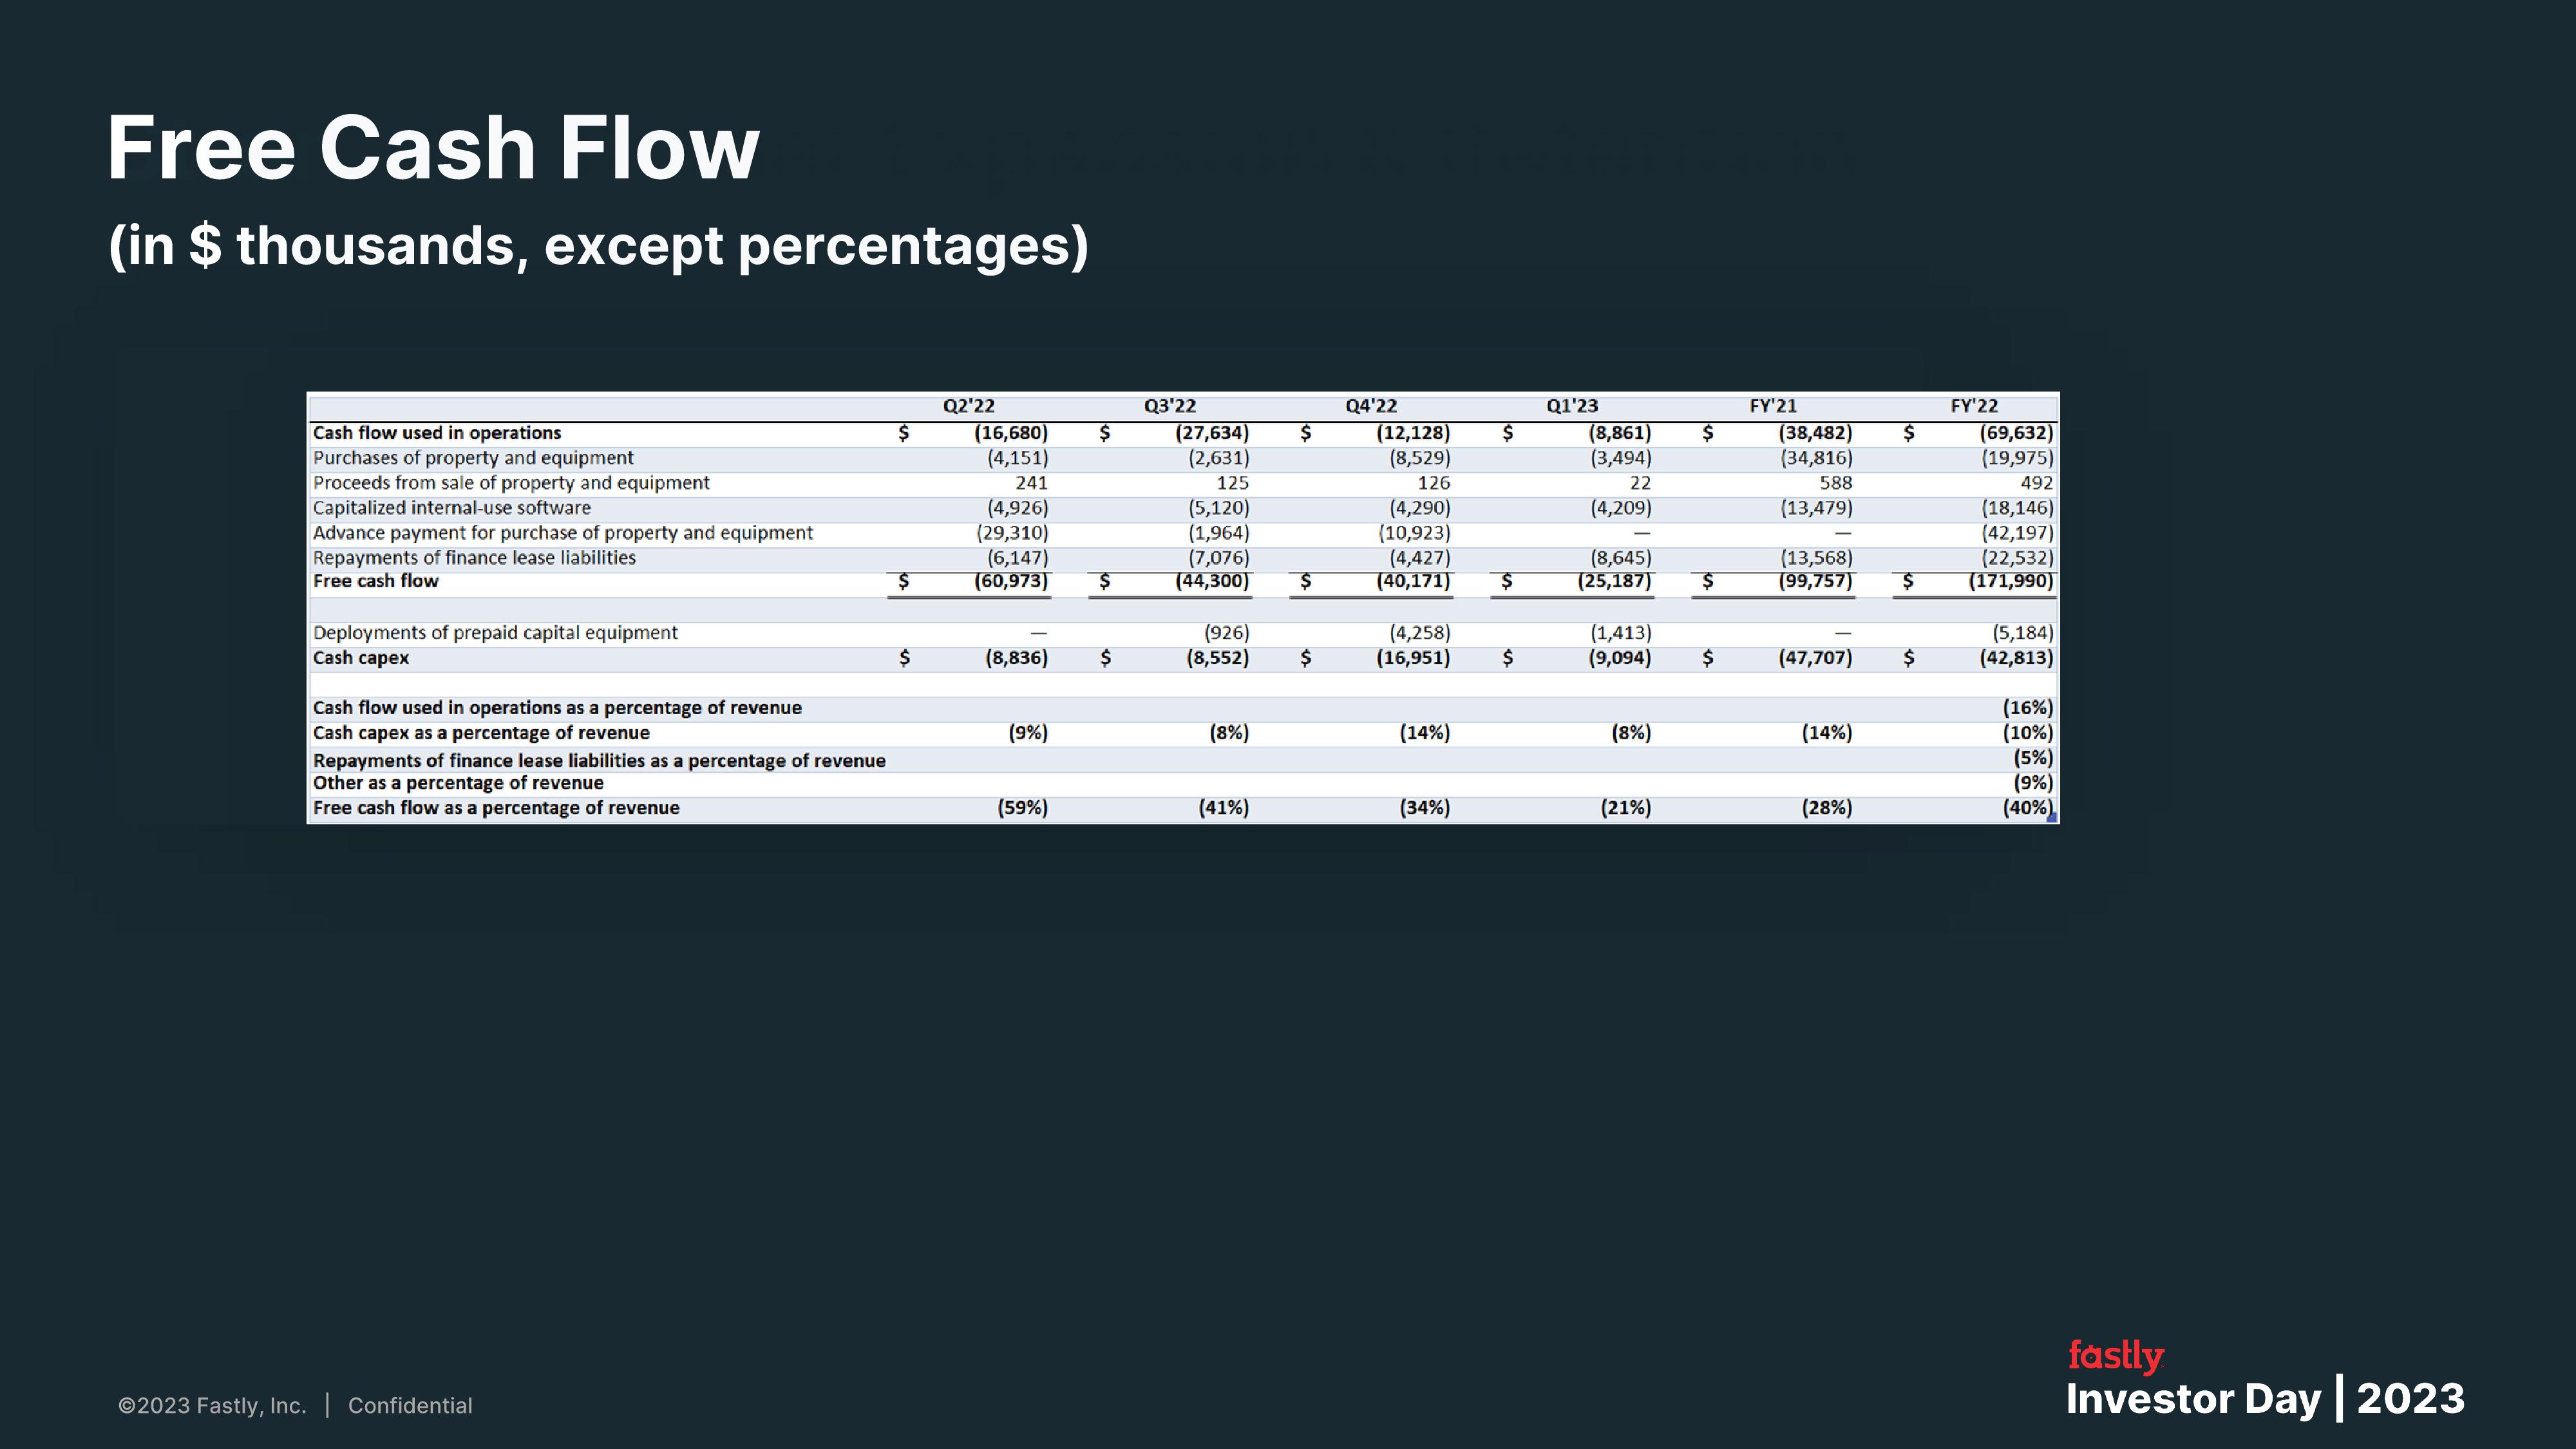
Free Cash Flow
(in $ thousands, except percentages)
Cash flow used in operations
Purchases of property and equipment
Proceeds from sale of property and equipment
Capitalized internal-use software
Advance payment for purchase of property and equipment
Repayments of finance lease liabilities
Free cash flow
Deployments of prepaid capital equipment
Cash capex
Cash flow used in operations as a percentage of revenue
Cash capex as a percentage of revenue
Repayments of finance lease liabilities as a percentage of revenue
Other as a percentage of revenue
Free cash flow as a percentage of revenue
Ⓒ2023 Fastly, Inc. | Confidential
$
$
Q2'22
(16,680)
(4,151)
241
(4,926)
(29,310)
(6,147)
(60,973)
(8,836)
(9%)
(59%)
$
$
$
Q3'22
(27,634)
(2,631)
125
(5,120)
(1,964)
(7,076)
(44,300)
(926)
(8,552)
(8%)
(41%)
$
$
$
Q4'22
(12,128)
(8,529)
126
(4,290)
(10,923)
(4,427)
(40,171)
(4,258)
(16,951)
(14%)
(34%)
$
$
Q1'23
(8,861)
(3,494)
22
(4,209)
(8,645)
(25,187)
(1,413)
(9,094)
(8%)
(21%)
$
$
$
FY'21
(38,482)
(34,816)
588
(13,479)
(13,568)
(99,757)
(47,707)
(14%)
(28%)
$
FY'22
$
(69,632)
(19,975)
492
(18,146)
(42,197)
(22,532)
$ (171,990)
(5,184)
(42,813)
(16%)
(10%)
(5%)
(9%)
(40%)
fastly
Investor Day | 2023View entire presentation