J.P.Morgan Investment Banking Pitch Book
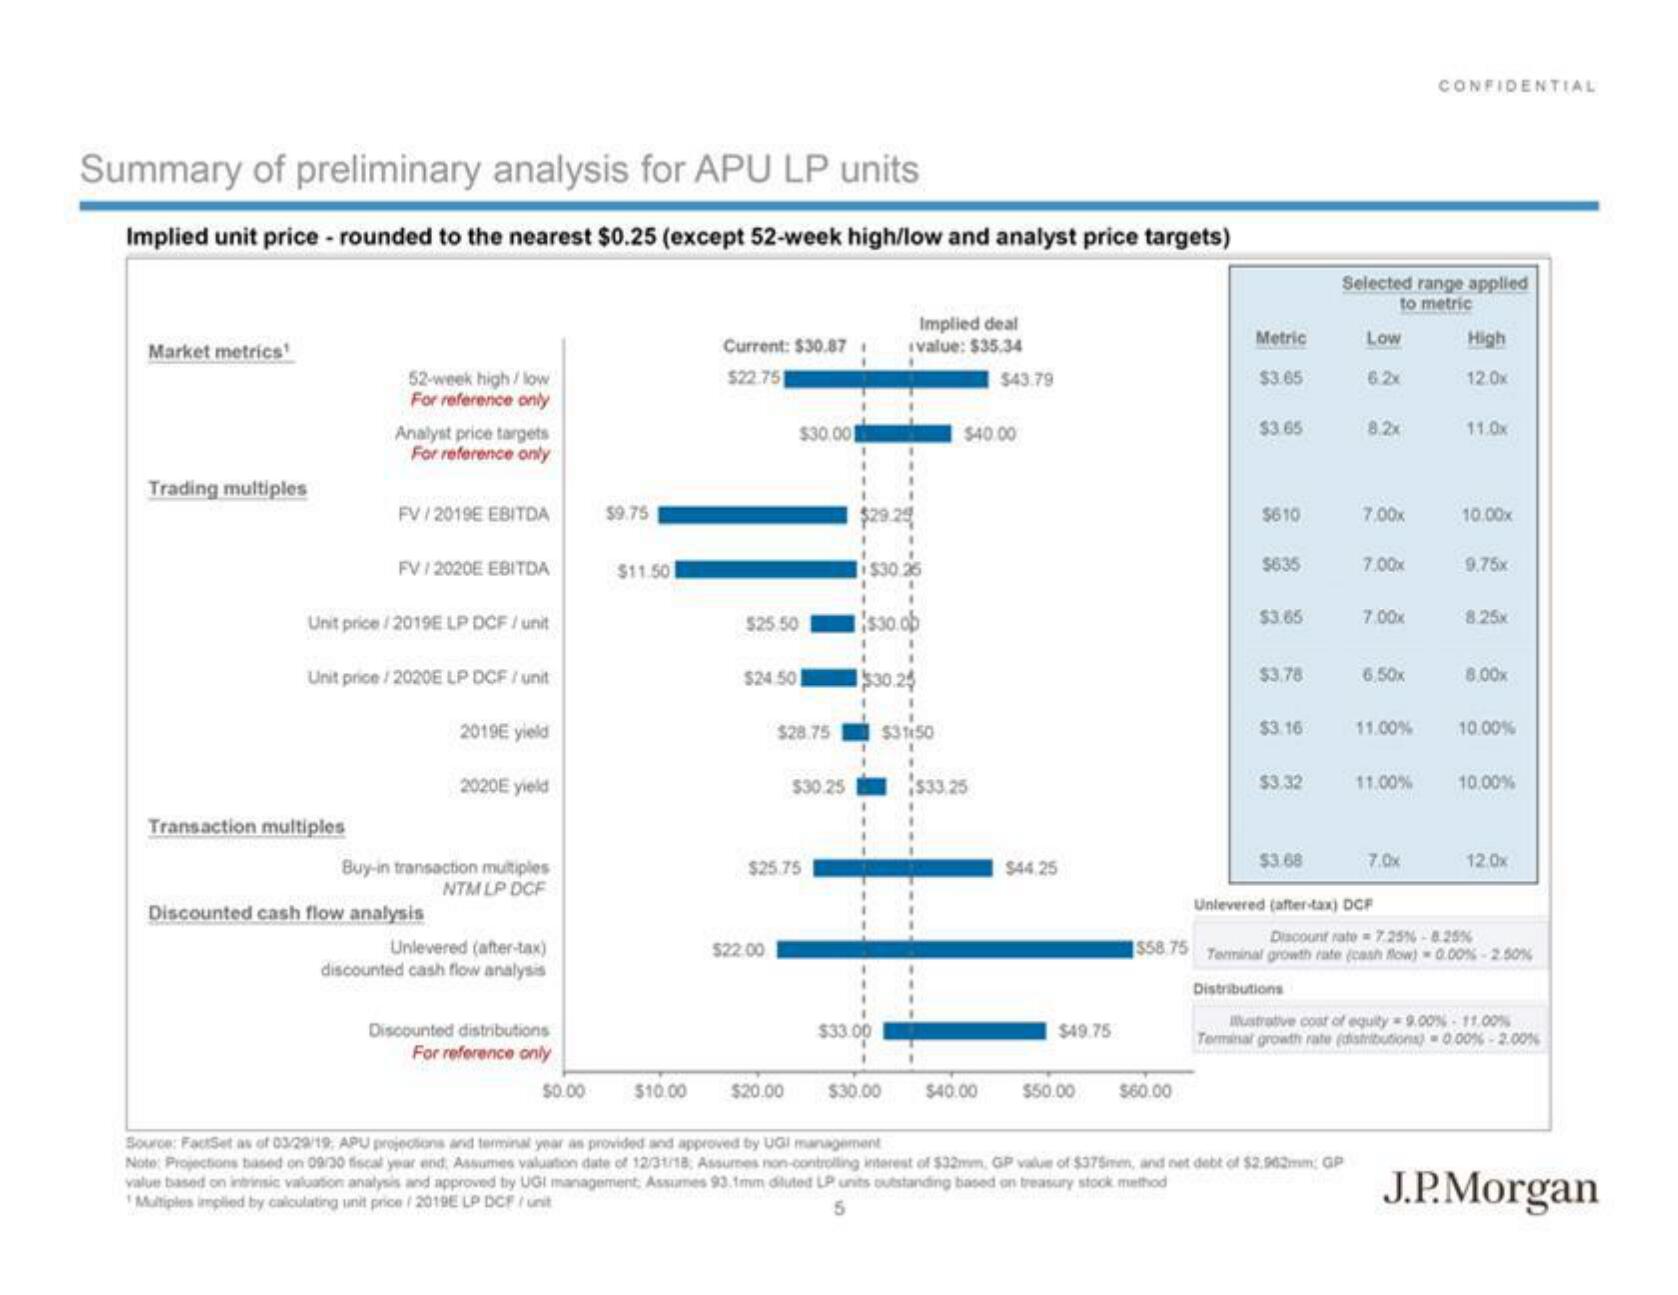
Summary of preliminary analysis for APU LP units
Implied unit price - rounded to the nearest $0.25 (except 52-week high/low and analyst price targets)
Market metrics
Trading multiples
52-week high/low
For reference only
Transaction multiples
Analyst price targets
For reference only
FV/2019E EBITDA
FV/2020E EBITDA
Unit price/2019E LP DCF / unit
Unit price / 2020ELP DCF / unit
2019€ yield
2020E yield
Buy-in transaction multiples
NTM LP DCF
Discounted cash flow analysis
Unlevered (after-tax)
discounted cash flow analysis
Discounted distributions
For reference only
$9.75
$11.50
$0.00 $10.00
Current: $30.87
$22.751
$25.50
$24.50
$30.00
$22.00
$28.75
$25.75
$20.00
$30.25
$30
$30.25
1
$33.00
$30.00
Implied deal
value: $35.34
$31150
$40.00
$33.25
$43.79
$40.00
$44.25
$49.75
$50.00
Metric
$3.65
$60.00
$3.65
$610
$635
$3.65
$3.78
$3.16
$3.32
$3.68
Selected range applied
to metric
Low
6.2x
8.2x
Source: FactSet as of 03/29/19; APU projections and terminal year as provided and approved by UGI management
Note: Projections based on 09/30 fiscal year end, Assumes valuation date of 12/31/18, Assumes non-controlling interest of $32mm, GP value of $375mm, and net debt of $2.962mm; GP
value based on intrinsic valuation analysis and approved by UGI management Assumes 93.1mm diluted LP units outstanding based on treasury stock method
Multiples implied by calculating unit price / 2019E LP DCF / unit
7.00x
7.00x
7.00x
6,50x
11.00%
11.00%
7.0x
Untevered (after-tax) DCF
CONFIDENTIAL
High
12.0x
11.0x
10.00x
9.75x
8.25x
8.00x
10.00%
10,00%
Discount rate=7.25% -8.25%
$58.75 Tenninal growth rate (cash flow) 0.00%-2.50%
Distributions
12.0x
Mustrative coat of equity=9.00% 11.00%
Terminal growth rate (distributions)=0.00%-2.00%
J.P.MorganView entire presentation