Zegna Results Presentation Deck
GROUP REVENUES BY SALES CHANNEL
(PRELIMINARY AND UNAUDITED)
(E thousands,
except
percentages)
Revenues
Zegna branded
products
Thom Browne
Tom Ford
H1 2023
Direct to Consumer (DTC)
Zegna branded
products
Thom Browne
Tom Ford
Total Direct to
Customer
Wholesale
Third Party
Brands and
Total
Other
903,059
465,710
82,924
34,751
583,385
75,609
124,027
29,264
88,549
317,449
2,225
% of
Revenues
100.0%
64.6%
35.2%
0.2%
H1 2022
728,993
361,850
66,174
428,024
63,402
118,992
116,309
298,703
2,266
% of
Revenues
100.0%
58.7%
41.0%
0.3%
H1 2023 vs H1 2022
Reported
Revenues
23.9%
28.7%
25.3%
-%
36.3%
19.3%
4.2%
n.m.
(23.9%)
6.3%
n.m.
Constant
Currency
24.7%
30.3%
30.6%
n.m.
38.6%
17.9%
4.2%
n.m.
(24.9%)
5.5%
n.m.
Organic
Growth
21.5%
30.3%
30.6%
n.m.
30.4%
17.9%
4.2%
n.m.
4.2%
7.6%
n.m.
Q2 2023
474,747
236,114
40,075
34,751
310,940
33,316
54.324
29,264
45,821
162,725
1,082
% of
Revenues
100.0%
65.5%
34.3%
0.2%
Q2 2022
351,414
177,941
31,993
209,934
23,332
55,236
61,663
140,231
1,249
% of
Revenues
100.0%
59.7%
39.9%
0.4%
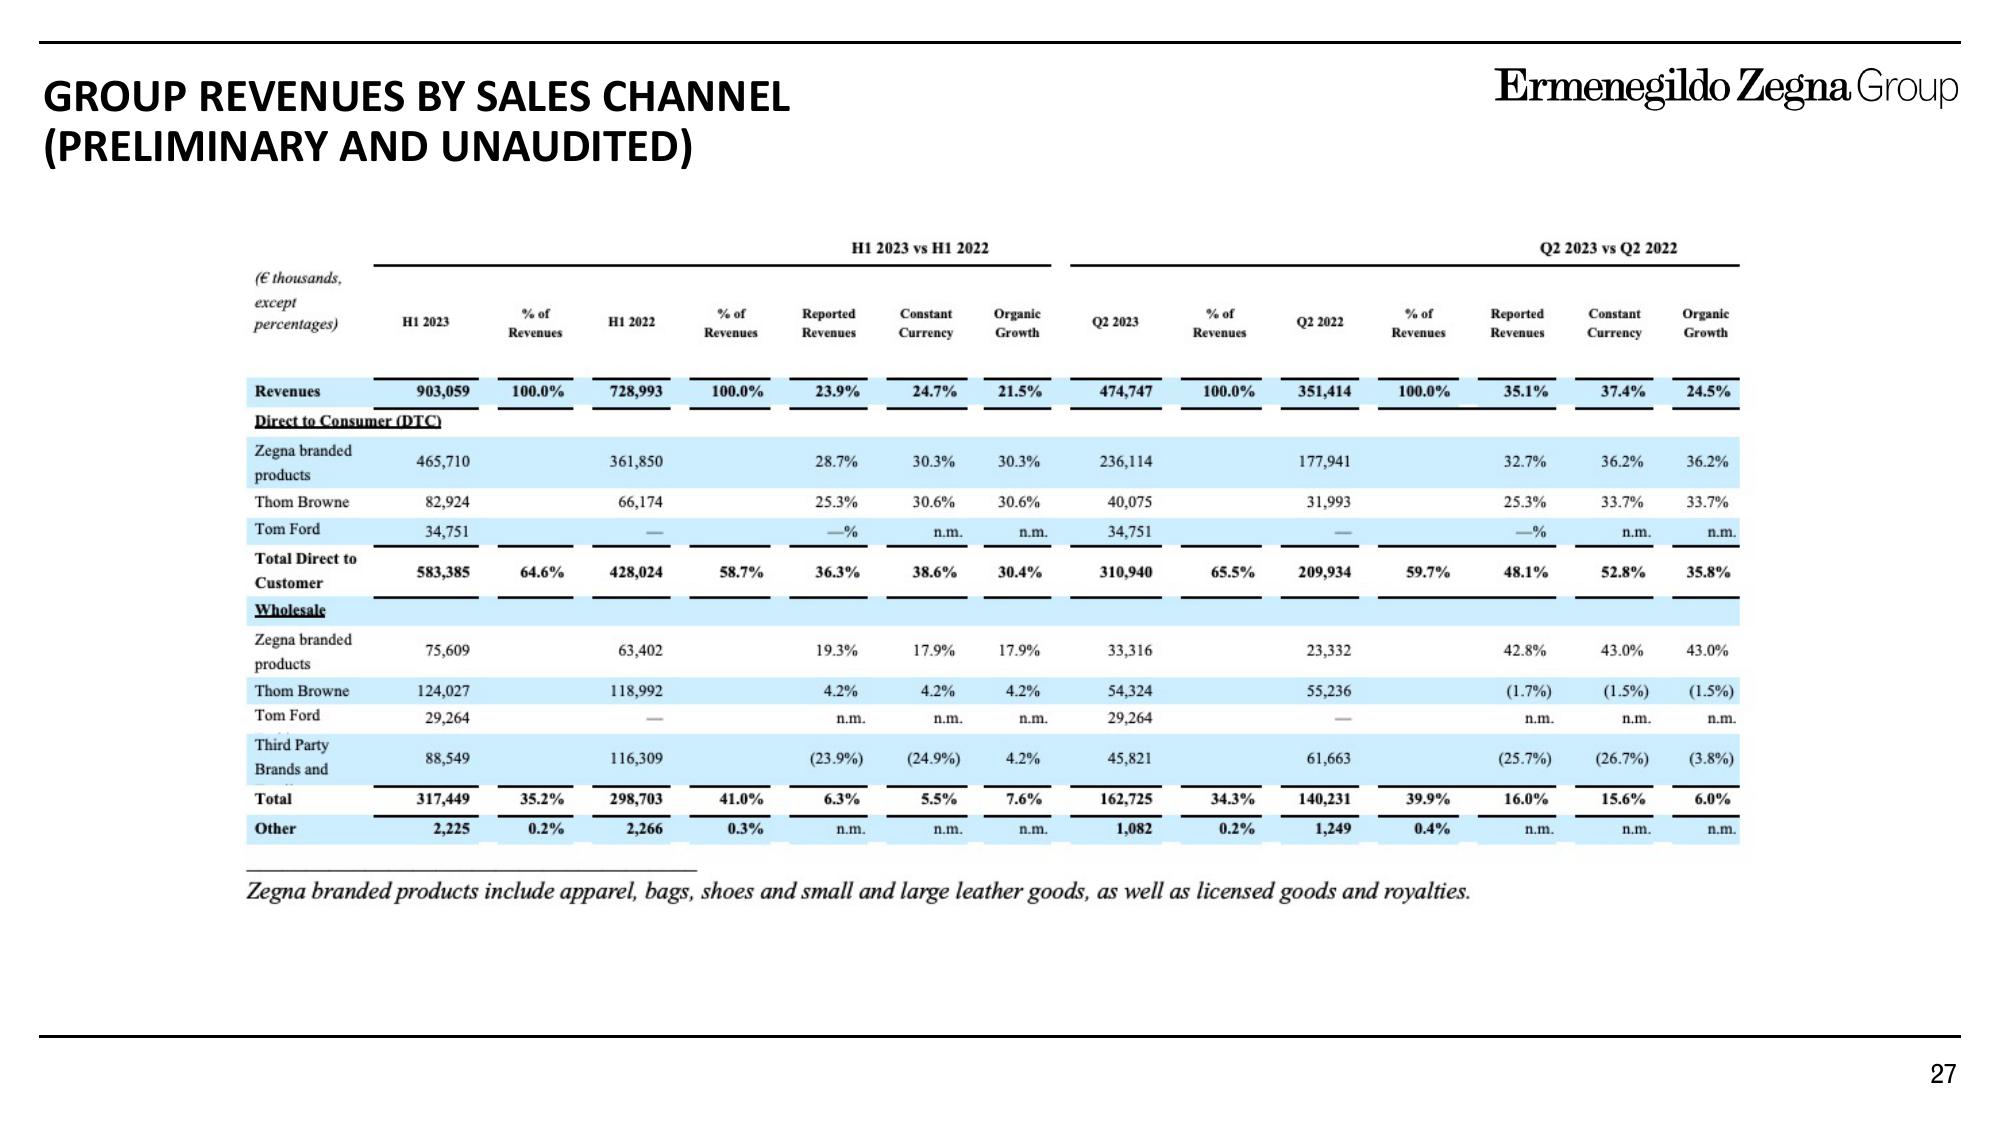
Zegna branded products include apparel, bags, shoes and small and large leather goods, as well as licensed goods and royalties.
Ermenegildo Zegna Group
Q2 2023 vs Q2 2022
Reported
Revenues
35.1%
32.7%
25.3%
48.1%
42.8%
(1.7%)
n.m.
(25.7%)
16.0%
n.m.
Constant
Currency
37.4%
36.2%
33.7%
n.m.
52.8%
|
43.0%
(1.5%)
n.m.
11
(26.7%)
15.6%
n.m.
Organic
Growth
24.5%
36.2%
33.7%
n.m.
35.8%
43.0%
(1.5%)
n.m.
(3.8%)
6.0%
n.m.
27View entire presentation