Antero Midstream Partners Investor Presentation Deck
Firm Transportation Portfolio Provides Visibility
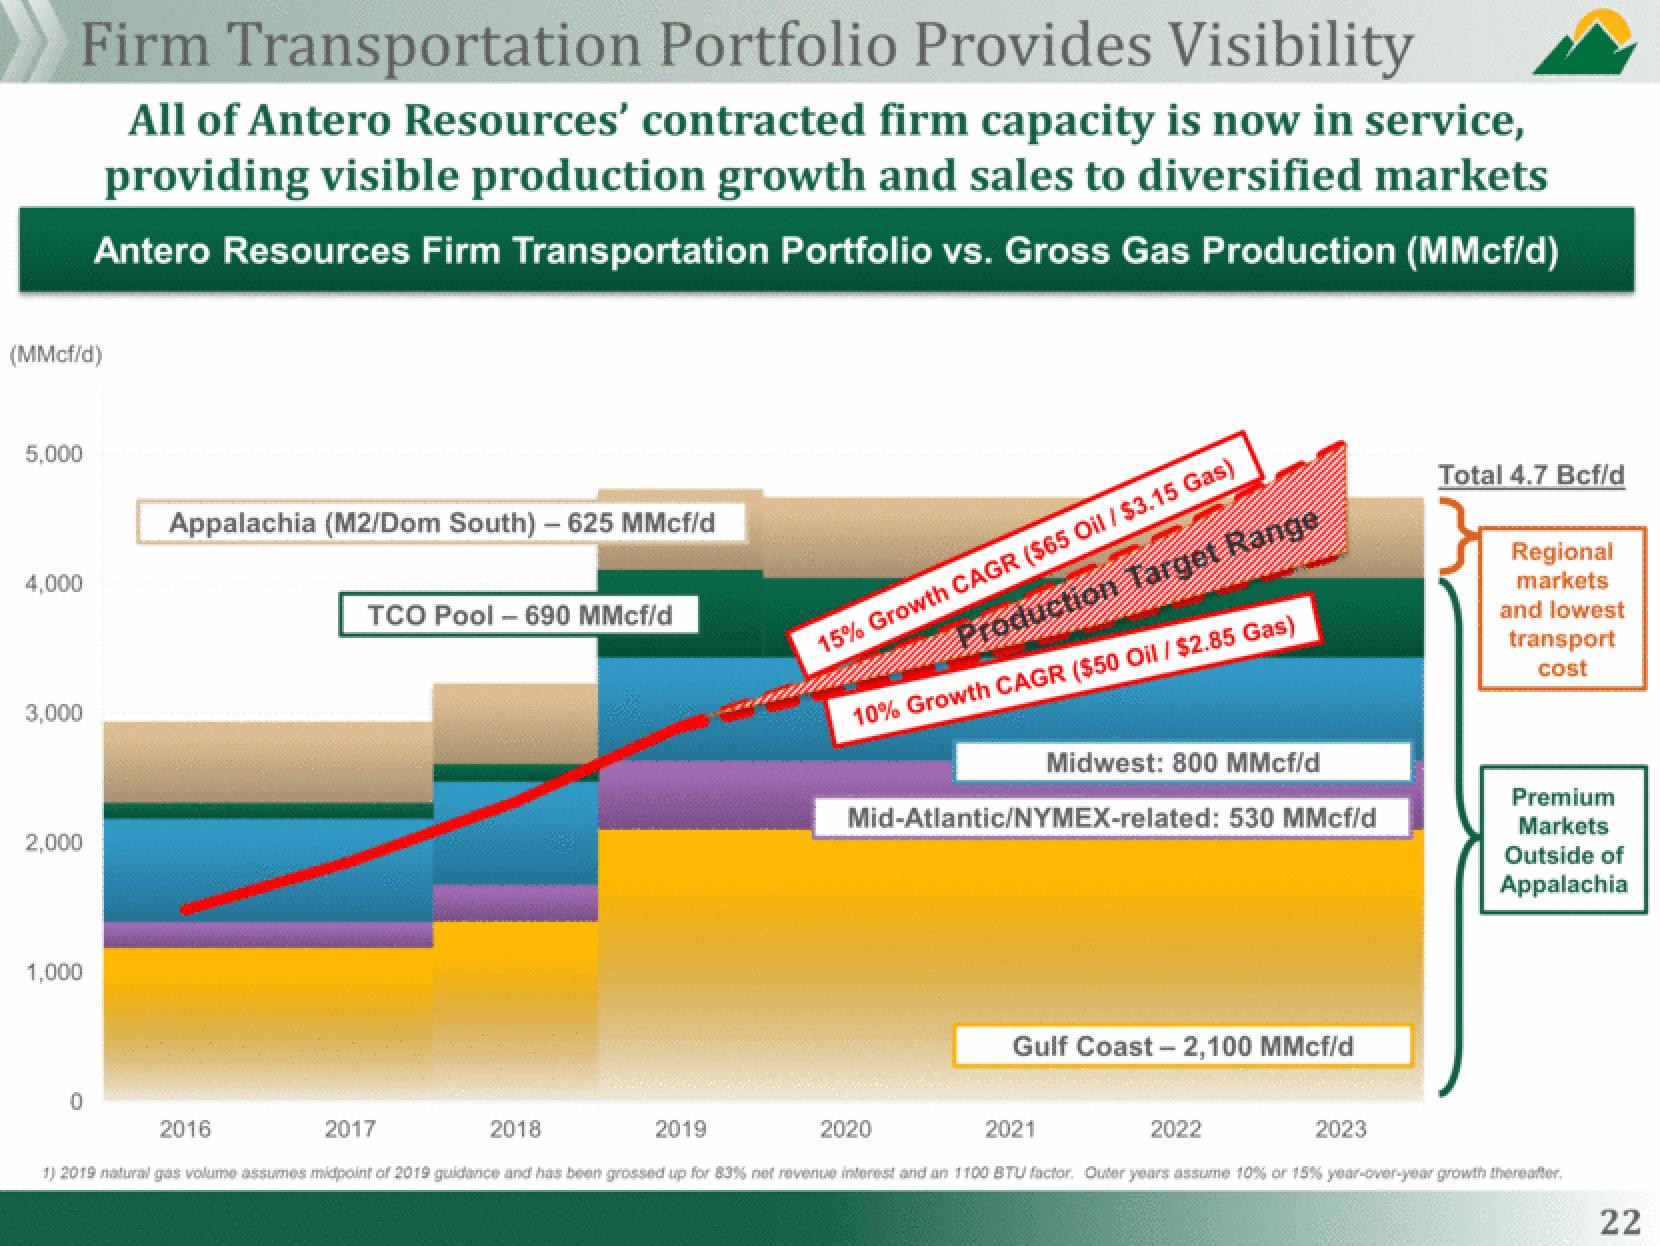
All of Antero Resources' contracted firm capacity is now in service,
providing visible production growth and sales to diversified markets
Antero Resources Firm Transportation Portfolio vs. Gross Gas Production (MMcf/d)
(MMcf/d)
5,000
4,000
3,000
2,000
1,000
0
Appalachia (M2/Dom South) - 625 MMcf/d
2016
TCO Pool - 690 MMcf/d
2017
2018
2019
15% Growth CAGR ($65 Oil / $3.15 Gas)
Production Target Range
10% Growth CAGR ($50 Oil / $2.85 Gas)
Midwest: 800 MMcf/d
Mid-Atlantic/NYMEX-related: 530 MMcf/d
2020
Gulf Coast - 2,100 MMcf/d
2021
2022
2023
Total 4.7 Bcf/d
Regional
markets
and lowest
transport
cost
Premium
Markets
Outside of
Appalachia
1) 2019 natural gas volume assumes midpoint of 2019 guidance and has been grossed up for 83% net revenue interest and an 1100 BTU factor. Outer years assume 10% or 15% year-over-year growth thereafter.
22View entire presentation