DraftKings SPAC Presentation Deck
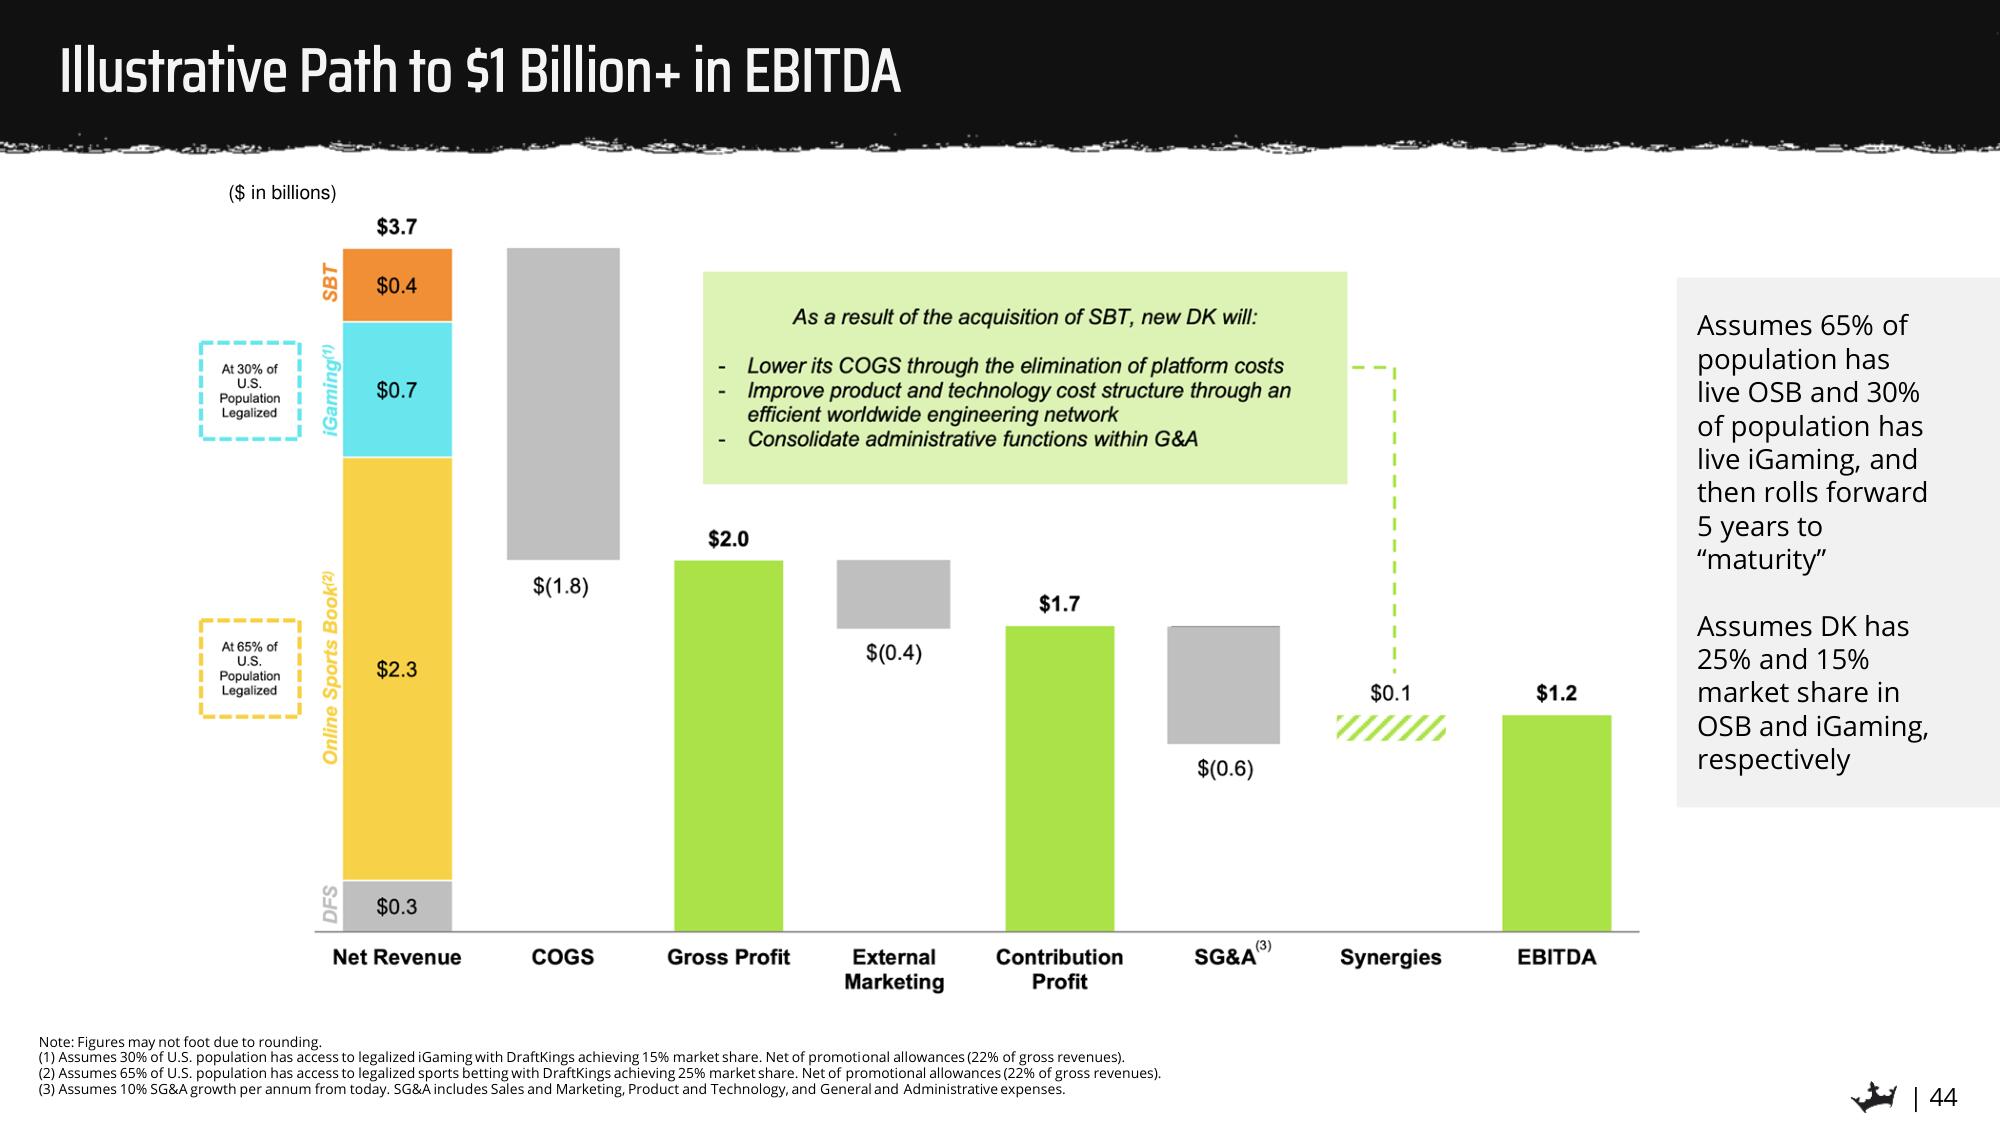
Illustrative Path to $1 Billion+ in EBITDA
($ in billions)
At 30% of
U.S.
Population
Legalized
At 65% of
U.S.
Population
Legalized
SBT
iGaming(¹)
Online Sports Book(2)
DFS
$3.7
$0.4
$0.7
$2.3
$0.3
Net Revenue
$(1.8)
COGS
As a result of the acquisition of SBT, new DK will:
Lower its COGS through the elimination of platform costs
Improve product and technology cost structure through an
efficient worldwide engineering network
Consolidate administrative functions within G&A
$2.0
Gross Profit
$(0.4)
External
Marketing
$1.7
Contribution
Profit
Note: Figures may not foot due to rounding.
(1) Assumes 30% of U.S. population has access to legalized iGaming with DraftKings achieving 15% market share. Net of promotional allowances (22% of gross revenues).
(2) Assumes 65% of U.S. population has access to legalized sports betting with DraftKings achieving 25 % market share. Net of promotional allowances (22% of gross revenues).
(3) Assumes 10% SG&A growth per annum from today. SG&A includes Sales and Marketing, Product and Technology, and General and Administrative expenses.
$(0.6)
(3)
SG&A
$0.1
Synergies
$1.2
EBITDA
Assumes 65% of
population has
live OSB and 30%
of population has
live iGaming, and
then rolls forward
5 years to
"maturity"
Assumes DK has
25% and 15%
market share in
OSB and iGaming,
respectively
| 44View entire presentation